VOILA Lab @ GT / NeurIPS 2025

Grids Often Outperform
Implicit Neural Representations

A controlled benchmark of how neural fields, hybrid models, discrete representations, and interpolated grids compress dense 2D and 3D signals.

Georgia Institute of Technology · VOILA Lab

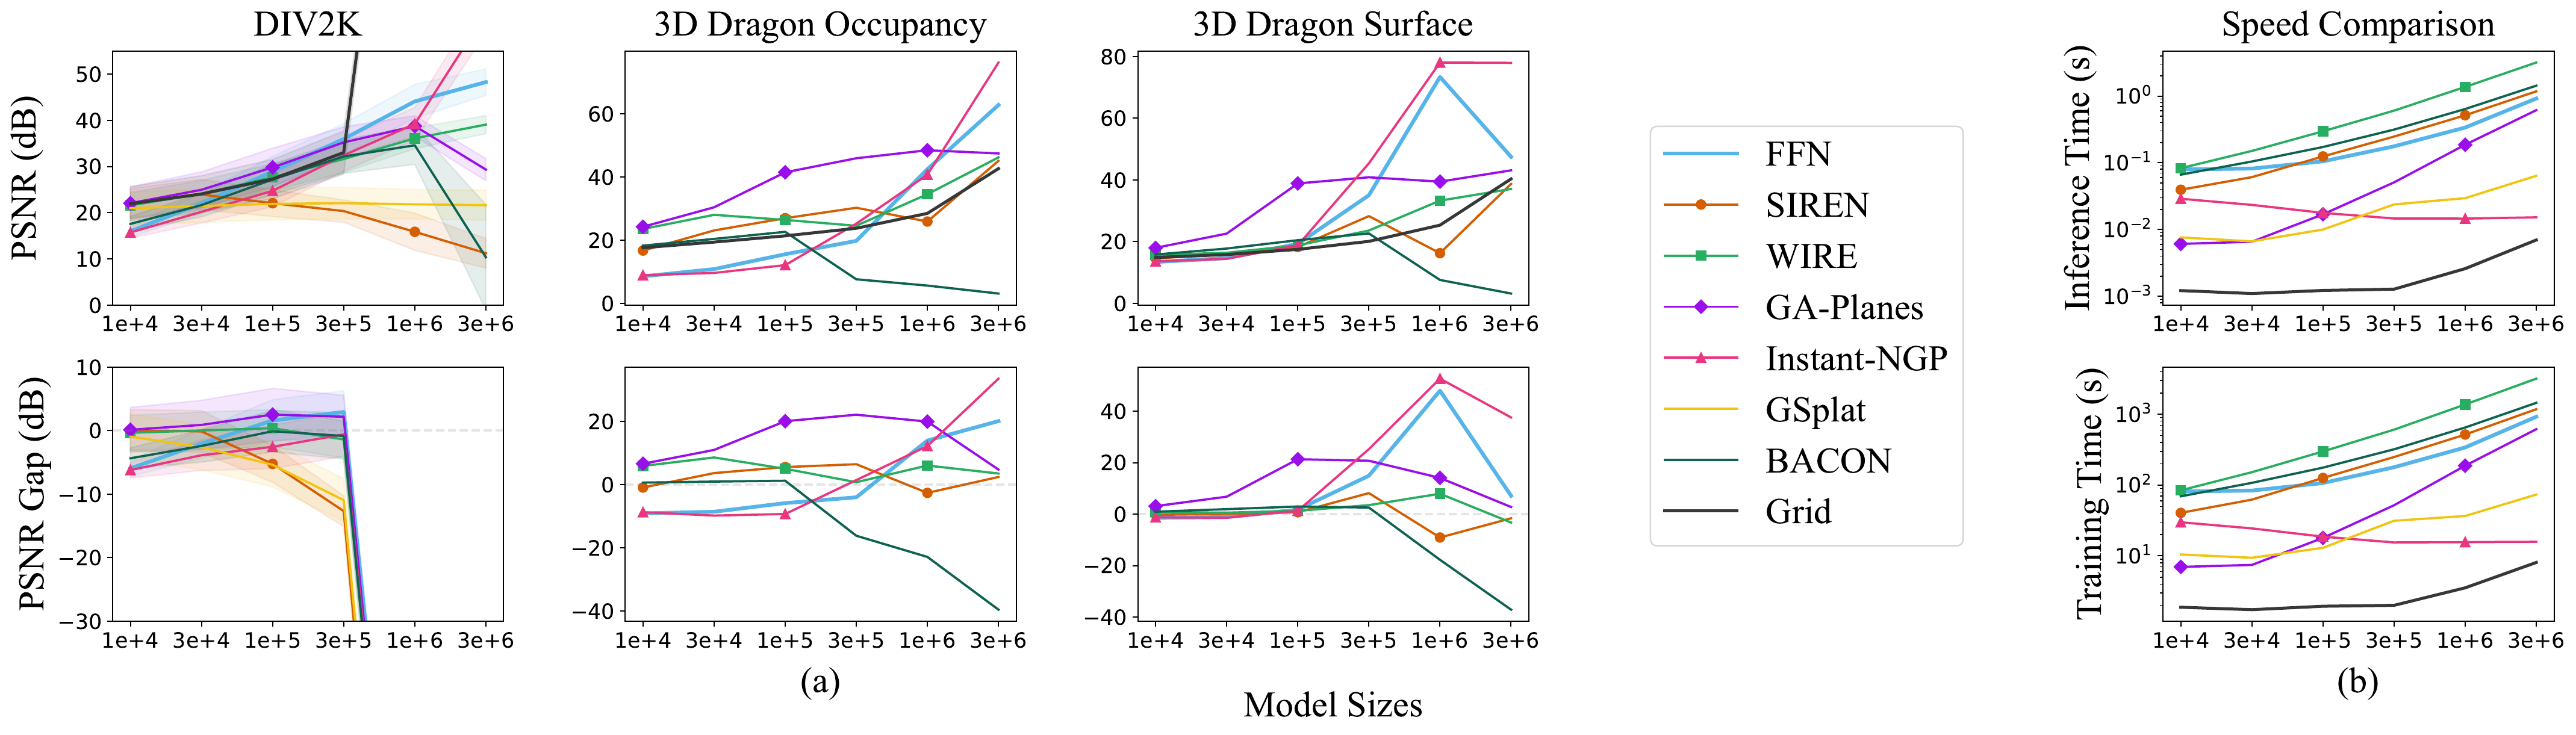
PSNR by parameter budget on DIV2K and Stanford Dragon signals, with a training-speed comparison

Matched-budget curves tell the full story. Across dense 2D and 3D signals, the interpolated grid is a fast, remarkably strong baseline—while adaptive models win selected structured 3D cases.

8representation families
6matched parameter budgets
9signal bandwidth levels
4PSNR, SSIM, LPIPS, and IoU

The question

Are neural fields always the right compression primitive?

Implicit neural representations have delivered striking results, but comparisons are often made on different data, at different model sizes, and with different tuning budgets. We put the leading families on the same footing.

Across dense natural and synthetic signals, a regularized grid with interpolation often trains faster and reaches higher or comparable fidelity at the same parameter budget. The exceptions are informative: neural and hybrid models can excel when the signal has lower-dimensional structure, such as binary shape contours.
Benchmark design

One protocol, deliberately diverse signals.

We vary effective bandwidth, model size, signal dimension, and task while keeping evaluation consistent.

01

Synthetic structure

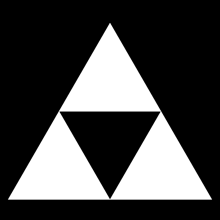
Spheres, bandlimited noise, Sierpinski fractals, and a radial Star Target expose scale-dependent bias.

02

Real signals

DIV2K imagery, sparse-view chest CT, and Stanford Dragon occupancy and surface volumes.

03

Eight model families

FFN, SIREN, WIRE, GA-Planes, Instant-NGP, GSplat, BACON, and an interpolated Grid.

04

Beyond fitting

Overfitting, denoising, super-resolution, tomography, and 3D shape upsampling.

Coverage map

Every signal family and task in the benchmark.

The synthetic suite isolates scale and structure; the real suite tests whether those trends survive in practical inverse problems.

Signal or datasetDomainScaleEvaluated tasks
Bandlimited noise2D + 3D synthetic9 frequency cutoffsCompressed signal fitting
Spheres2D + 3D synthetic9 feature scalesCompressed shape fitting
Sierpinski2D synthetic9 fractal levelsCompressed signal fitting
Star Target2D syntheticContinuous radial frequencyFitting, artifact analysis, hyperparameter tuning
DIV2K2D real · 10 imagesHigh-resolution RGBFitting, 4× super-resolution, denoising at ε = 0.05 and 0.1
Computed tomography2D real · 7 scansSparse X-ray projectionsUnderdetermined CT reconstruction
Stanford Dragon3D real · occupancy + surface≈1M voxels eachVolume fitting and super-resolution
PSNR reconstruction fidelity SSIM structural similarity LPIPS perceptual distance IoU 3D shape overlap

Synthetic signal atlas

Complexity increases from 0.1 to 0.9.

Twenty-seven source signals make the bandwidth sweep explicit instead of reducing it to a single example.

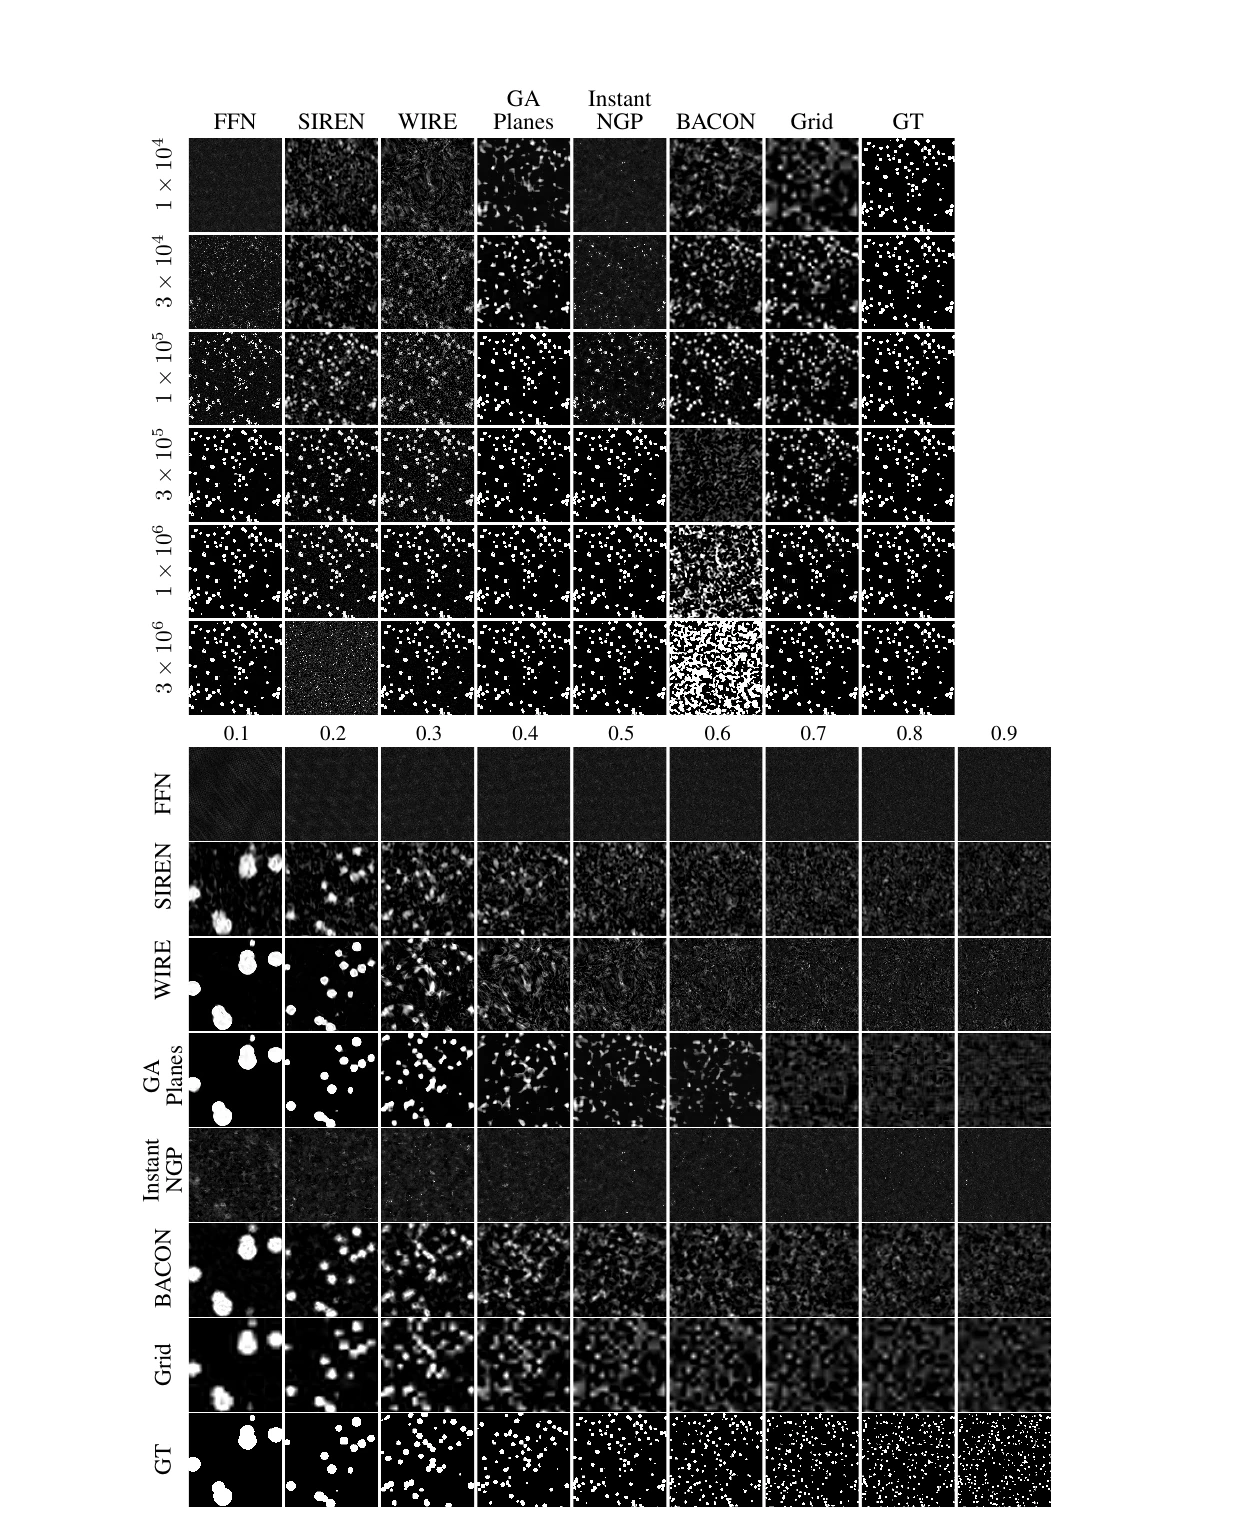
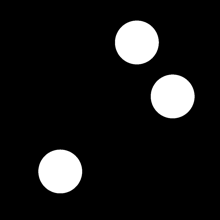
Spheres
Spheres signal at scale 0.1Spheres signal at scale 0.2Spheres signal at scale 0.3Spheres signal at scale 0.4Spheres signal at scale 0.5Spheres signal at scale 0.6Spheres signal at scale 0.7Spheres signal at scale 0.8Spheres signal at scale 0.9
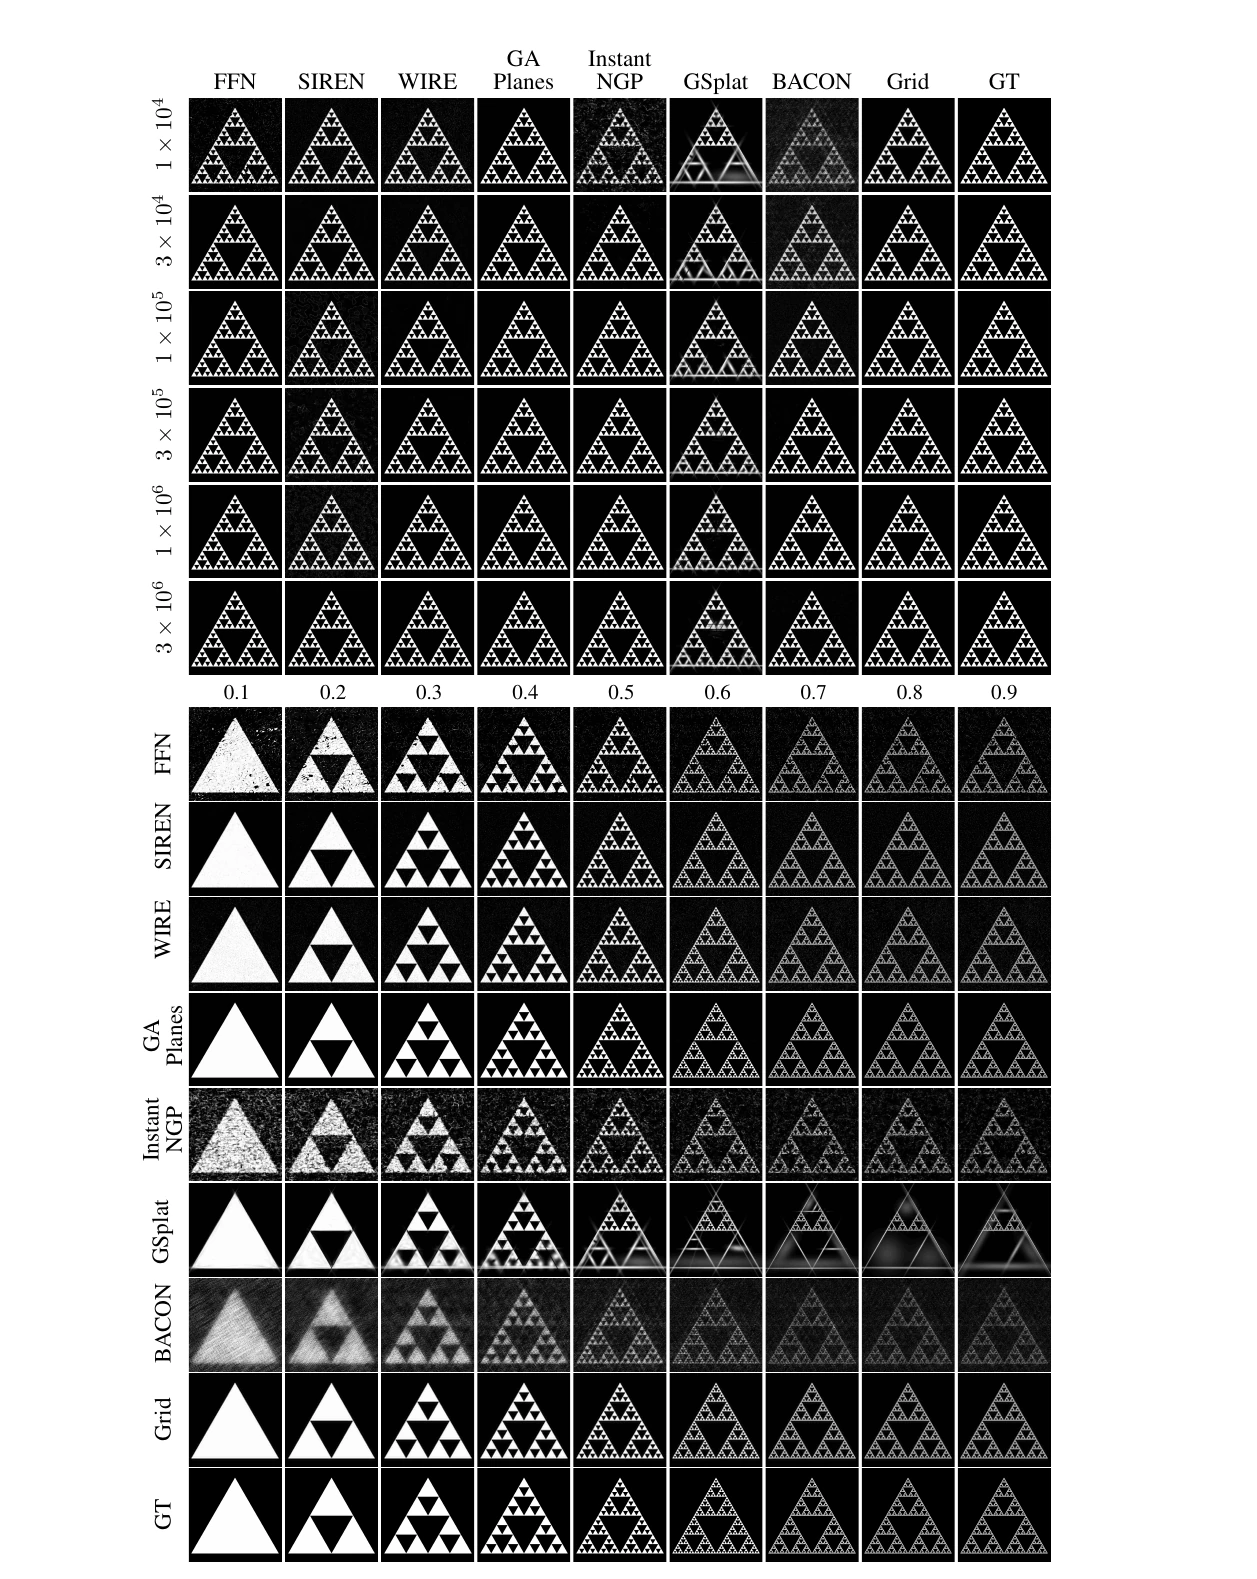
Sierpinski
Sierpinski signal at scale 0.1Sierpinski signal at scale 0.2Sierpinski signal at scale 0.3Sierpinski signal at scale 0.4Sierpinski signal at scale 0.5Sierpinski signal at scale 0.6Sierpinski signal at scale 0.7Sierpinski signal at scale 0.8Sierpinski signal at scale 0.9
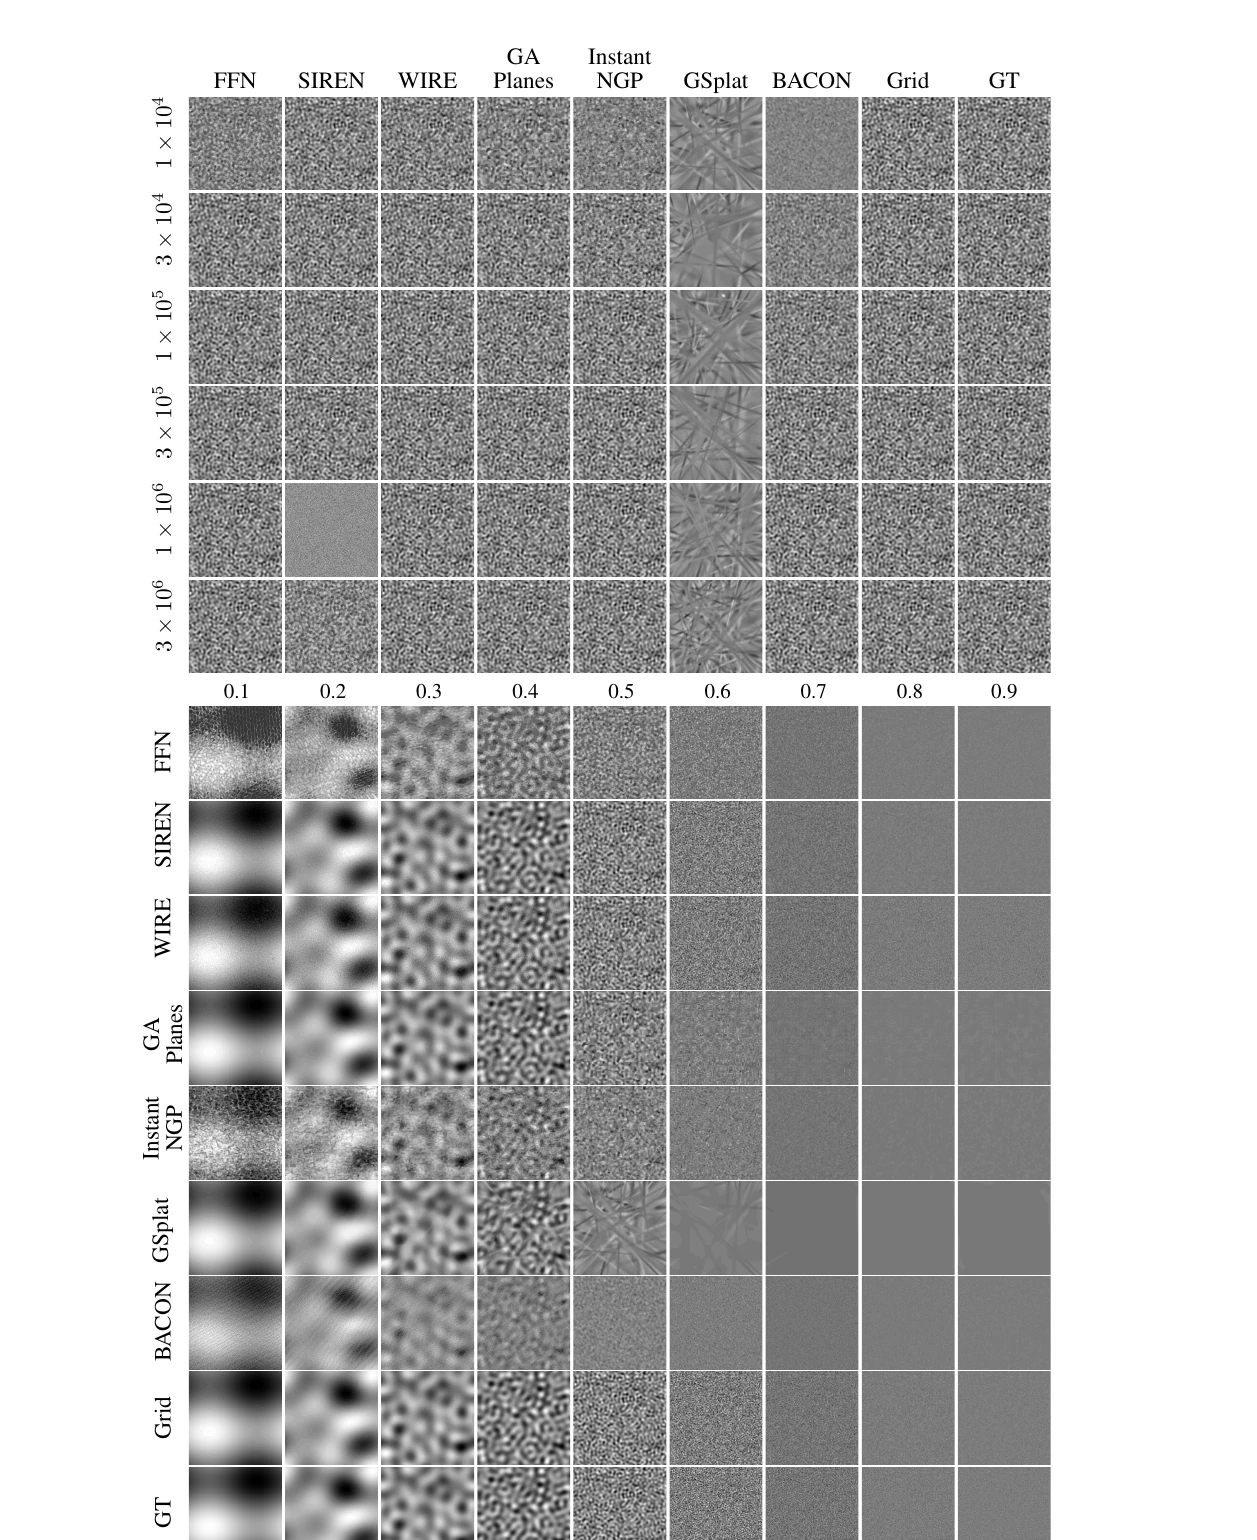
Bandlimited
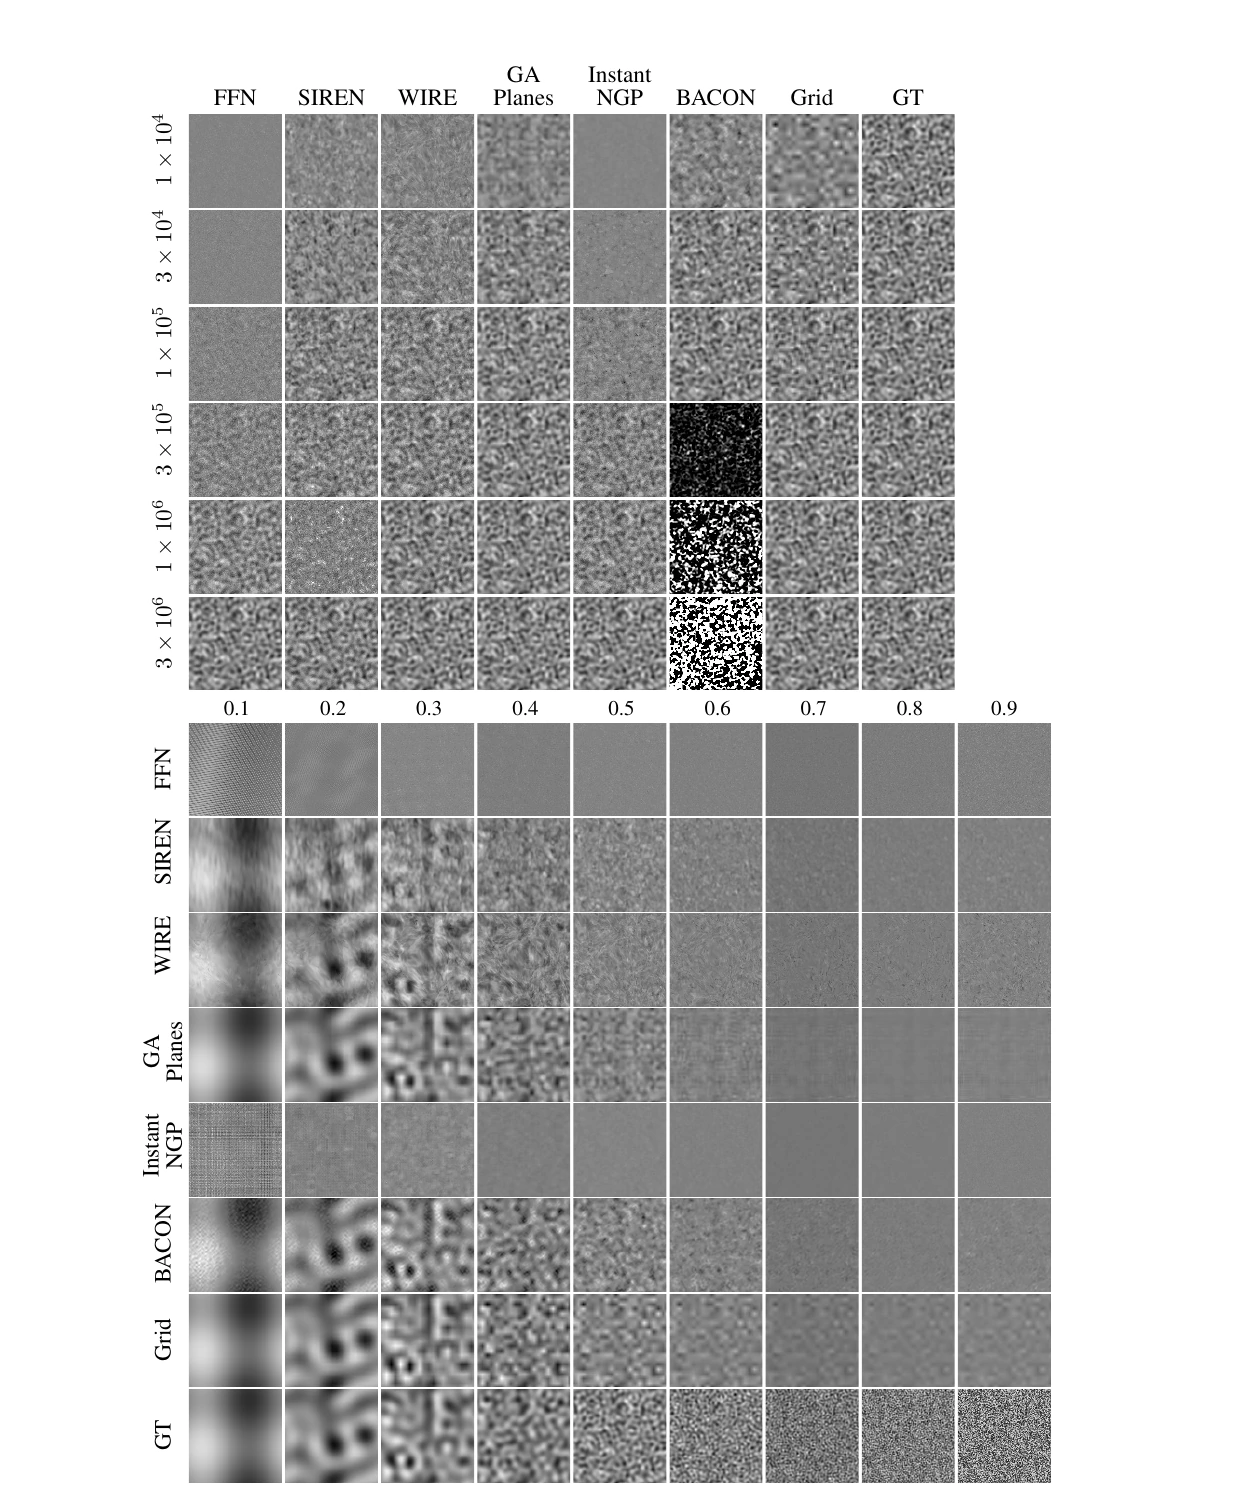
Bandlimited signal at cutoff 0.1Bandlimited signal at cutoff 0.2Bandlimited signal at cutoff 0.3Bandlimited signal at cutoff 0.4Bandlimited signal at cutoff 0.5Bandlimited signal at cutoff 0.6Bandlimited signal at cutoff 0.7Bandlimited signal at cutoff 0.8Bandlimited signal at cutoff 0.9

Representation roster

Eight approaches, matched by trainable parameter count.

The comparison spans pure neural fields, hybrid feature-grid models, a discrete Gaussian representation, and the explicit interpolated-grid baseline.

MethodFamilyRepresentation2D3D
FFNINRFourier feature encoding + ReLU MLP
SIRENINRCoordinate MLP with sinusoidal activations
WIREINRCoordinate MLP with complex Gabor wavelets
GA-PlanesHybridInterpolated line, plane, and volume features + MLP
Instant-NGPHybridMultiresolution hash encoding + MLP
GSplatDiscreteOptimized 2D Gaussian primitives
BACONINRCoordinate network with controlled sine filters
GridGridStored lattice values + bicubic or trilinear interpolation

Quantitative data explorer

Compare every method at six parameter budgets.

Select a task and model size to reproduce the main PSNR and IoU comparisons from the paper’s quantitative tables.

PSNR · higher is better

RankMethodFamilyPSNR (dB)Δ vs GridRelative score

Mean scores are shown for readability. The paper appendix reports standard deviations and the complete PSNR, SSIM, LPIPS, and IoU tables. GSplat is omitted from 3D tasks because it does not support direct volumetric fitting in this benchmark.

Qualitative results

The complete visual evidence from the appendix.

Outputs are organized by signal and task so the representation artifacts behind the aggregate scores stay visible. Select any plate to inspect the paper figure at full resolution.

Synthetic signals

Six controlled tests expose frequency and geometry bias.

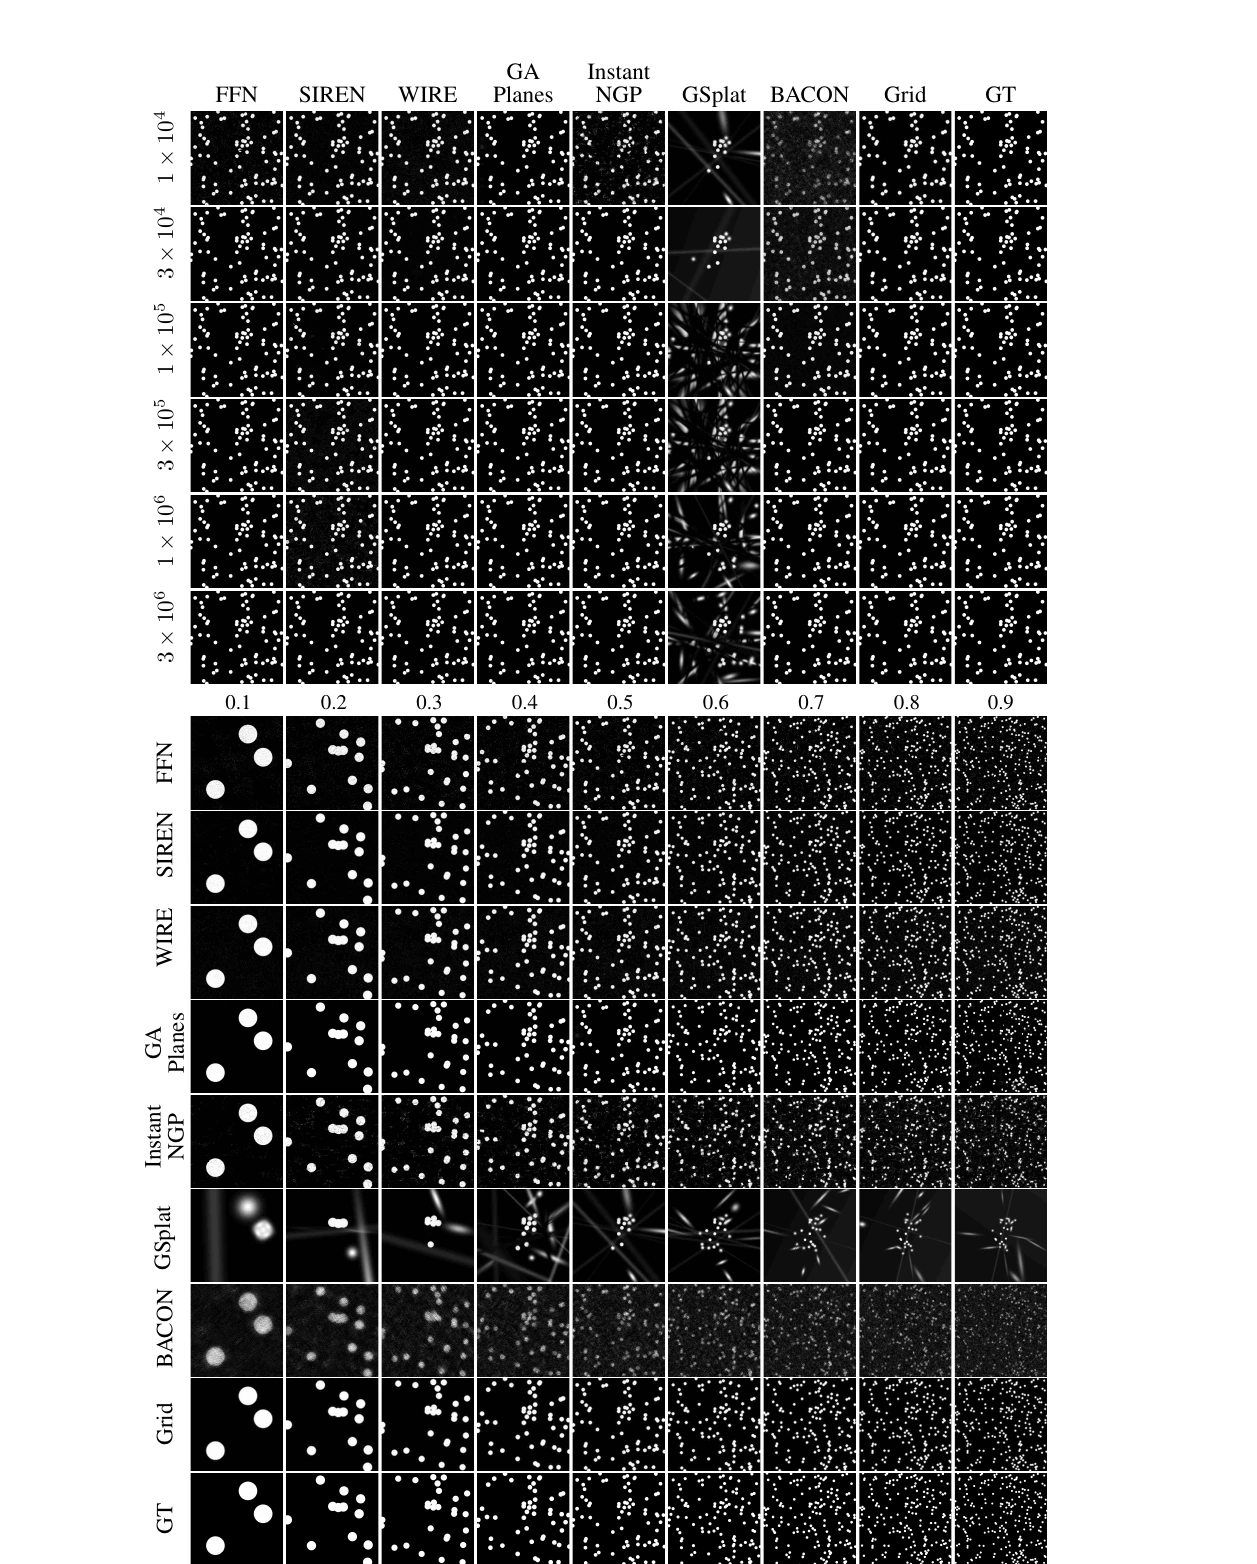
Each plate sweeps all matched parameter budgets across FFN, SIREN, WIRE, GA-Planes, Instant-NGP, GSplat where applicable, BACON, and Grid.

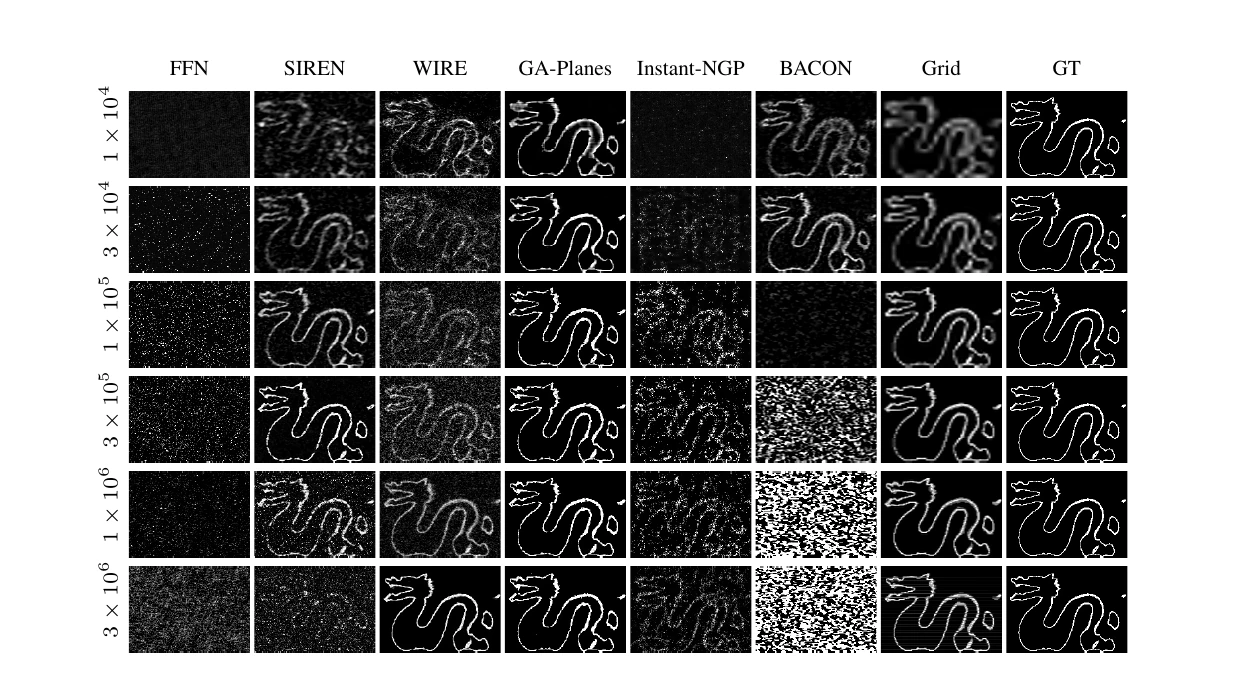
Qualitative fitting results for 2D sparse spheres across methods and parameter budgets
2D SpheresBinary contours reward representations that allocate capacity near sparse boundaries.
Qualitative fitting results for a 2D bandlimited signal across methods and parameter budgets
2D BandlimitedDense high frequencies reveal each model family’s effective bandwidth.
Qualitative fitting results for a 2D Sierpinski signal across methods and parameter budgets
2D SierpinskiRepeated multiscale edges make structural bias especially easy to see.
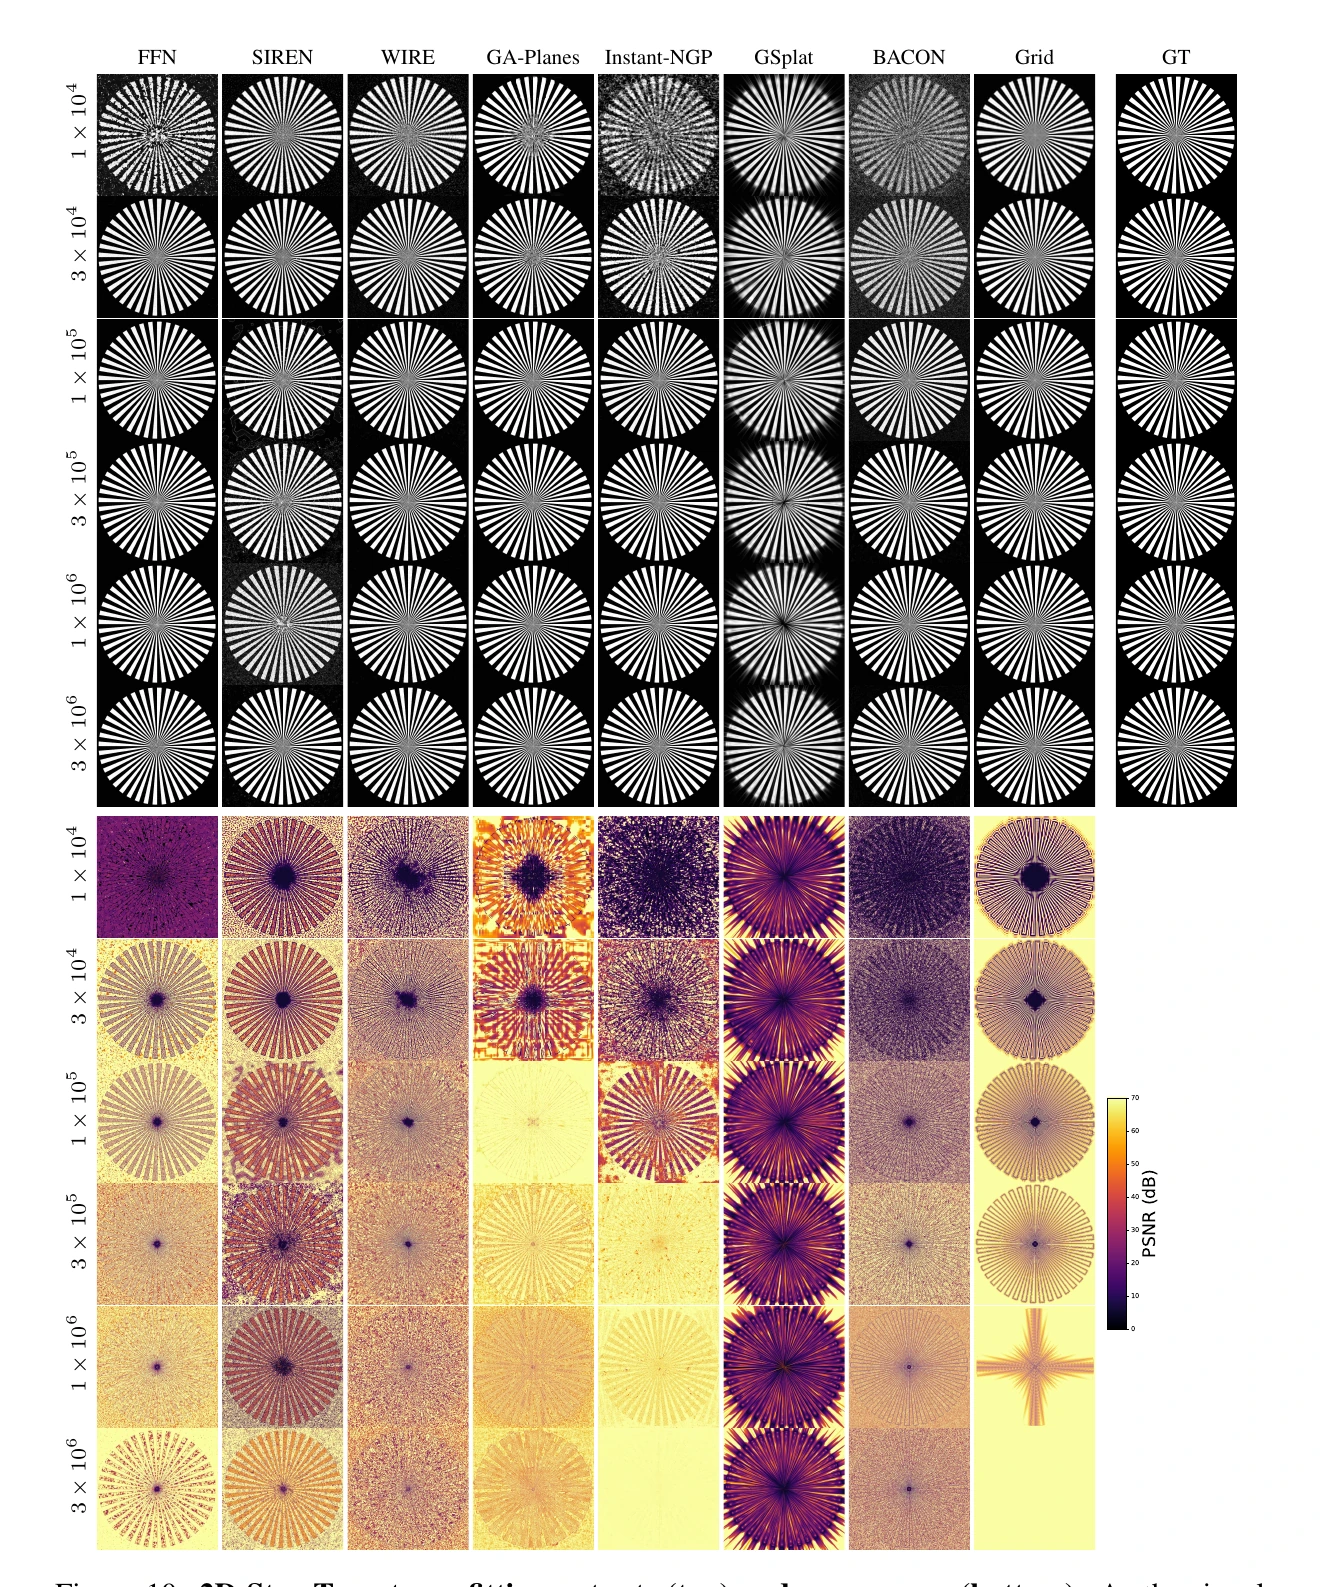
Star Target outputs and error maps across representation methods and parameter budgets
2D Star TargetReconstructions and error maps localize the radius where each method loses frequency support.
Qualitative fitting results for 3D sparse spheres across methods and parameter budgets
3D SpheresSparse volumetric boundaries favor adaptive and factorized representations at selected budgets.
Qualitative fitting results for a 3D bandlimited signal across methods and parameter budgets
3D BandlimitedDense volumetric texture makes compression artifacts visible slice by slice.

Real signals and inverse problems

Images, CT, and Stanford Dragon volumes.

The full appendix plates cover direct fitting, sparse-view reconstruction, denoising, image super-resolution, and 3D super-resolution in both slice and rendering views.

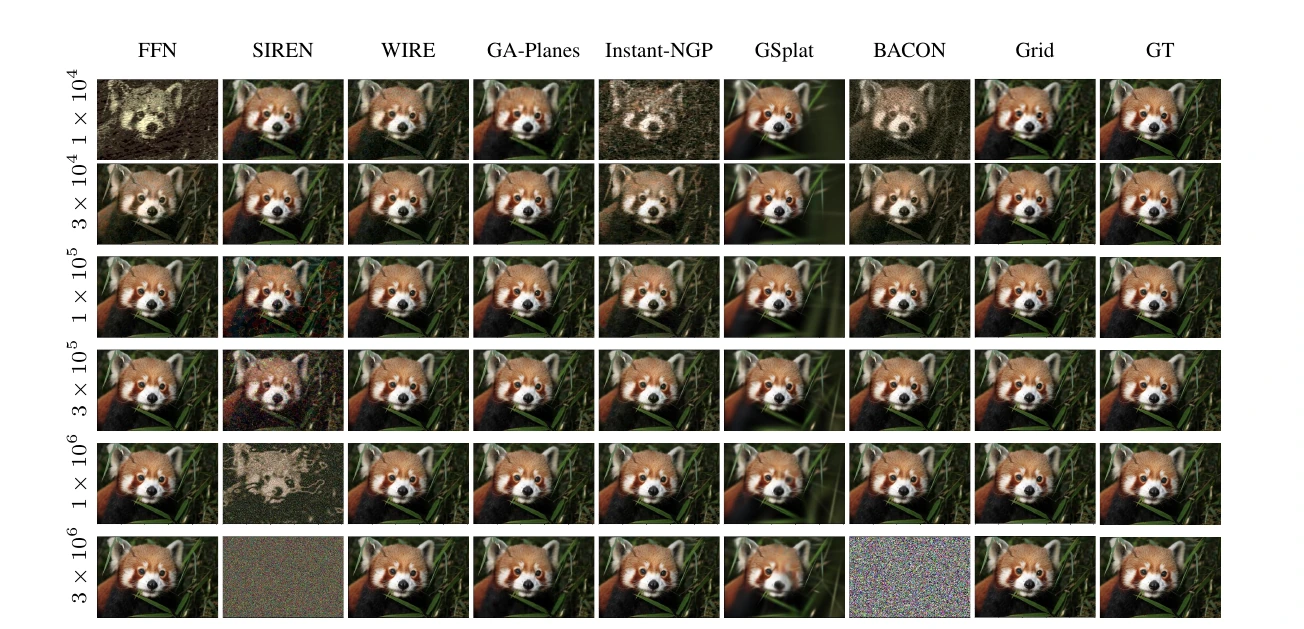
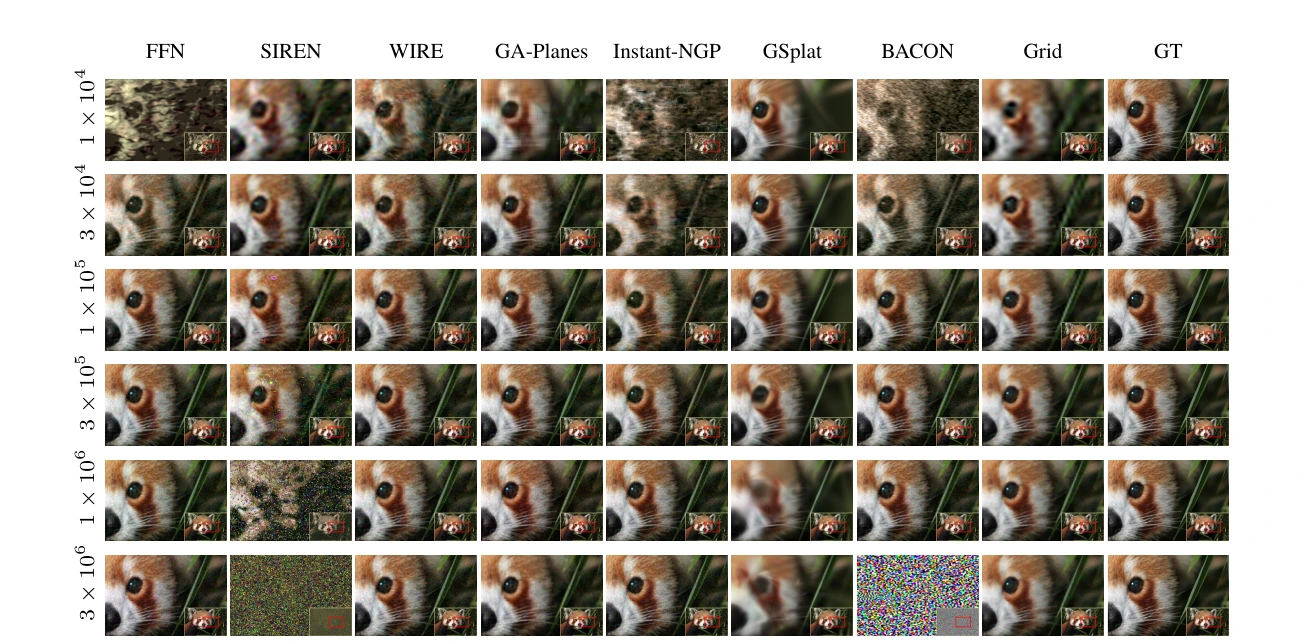
DIV2K direct fitting results across methods and parameter budgets
DIV2K · direct fittingNatural-image fitting shows small-budget color bias and the instability of selected models in the over-parameterized regime.
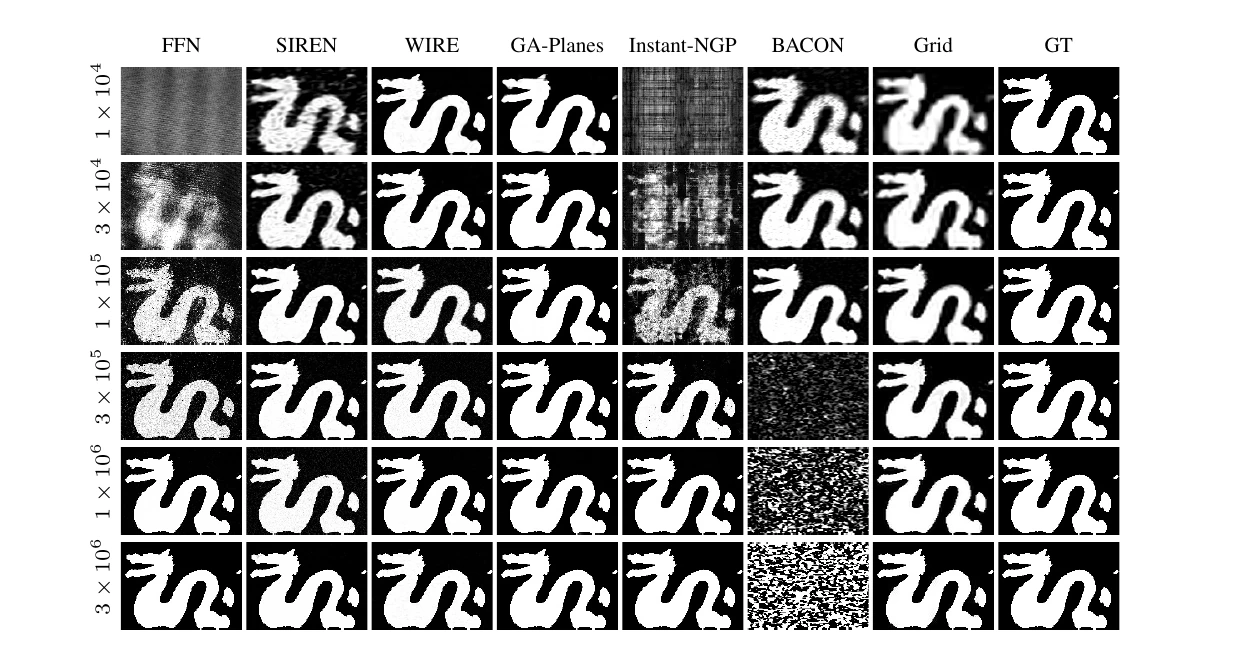
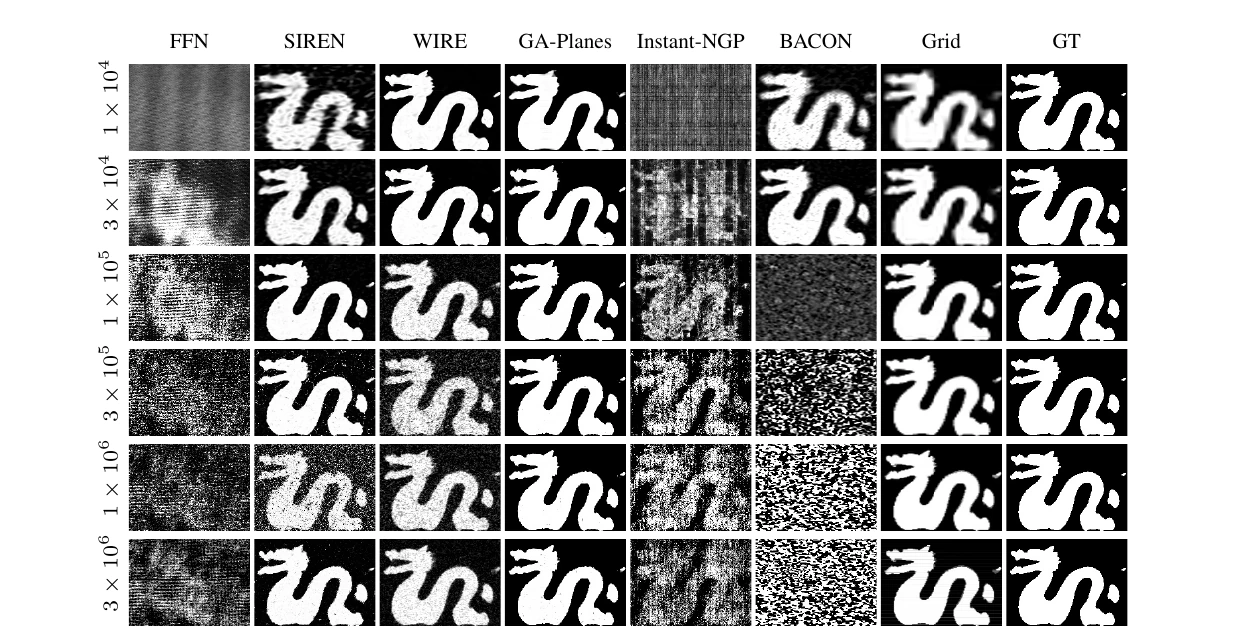
Stanford Dragon occupancy fitting shown as volume slices across methods and parameter budgets
Dragon Occupancy · fitting slicesBinary interior slices expose topology and boundary preservation.
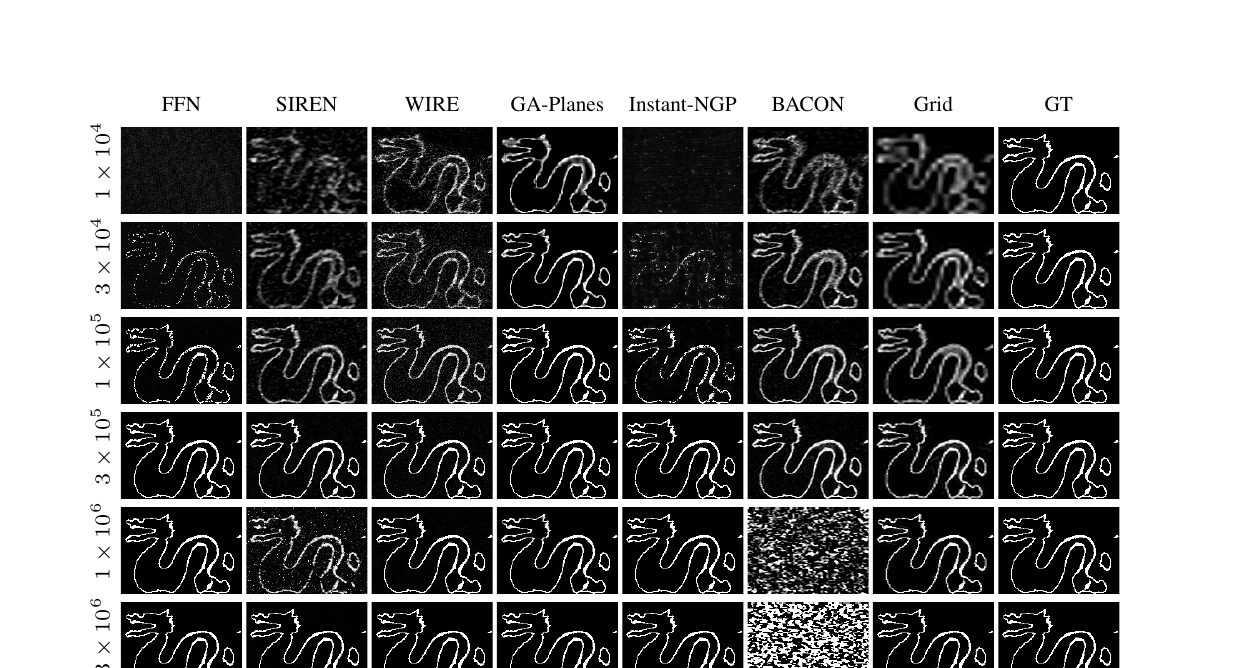
Stanford Dragon surface fitting shown as volume slices across methods and parameter budgets
Dragon Surface · fitting slicesA thin 3D surface rewards representations that focus capacity near geometry.
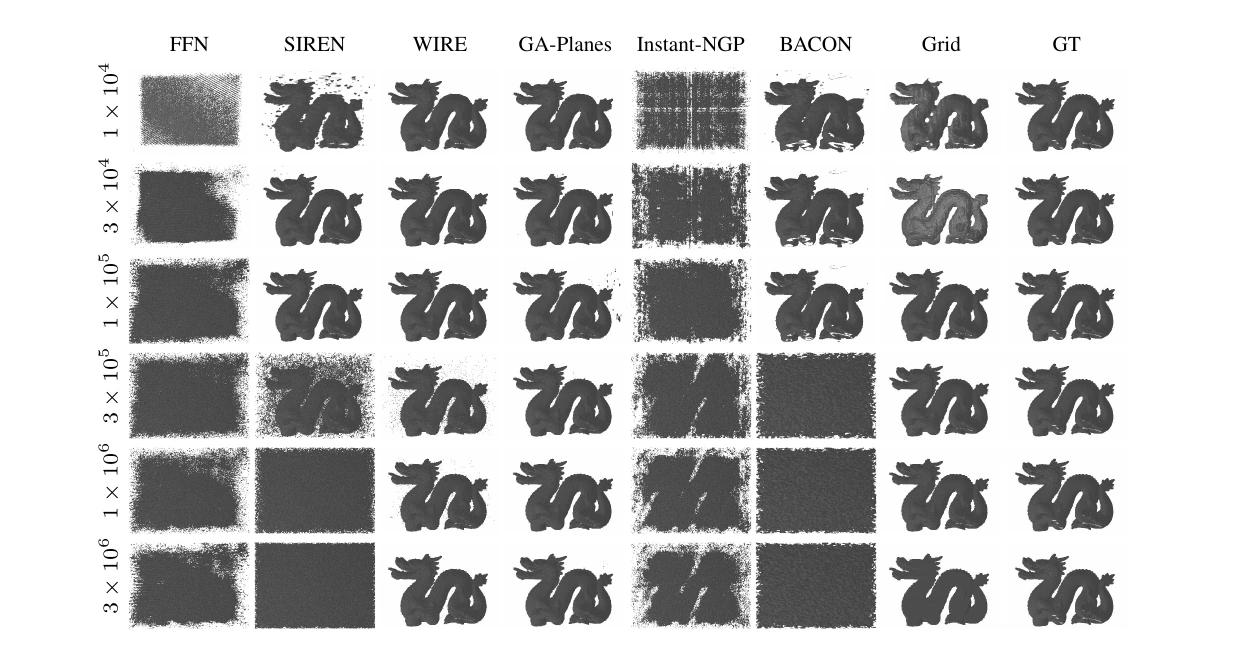
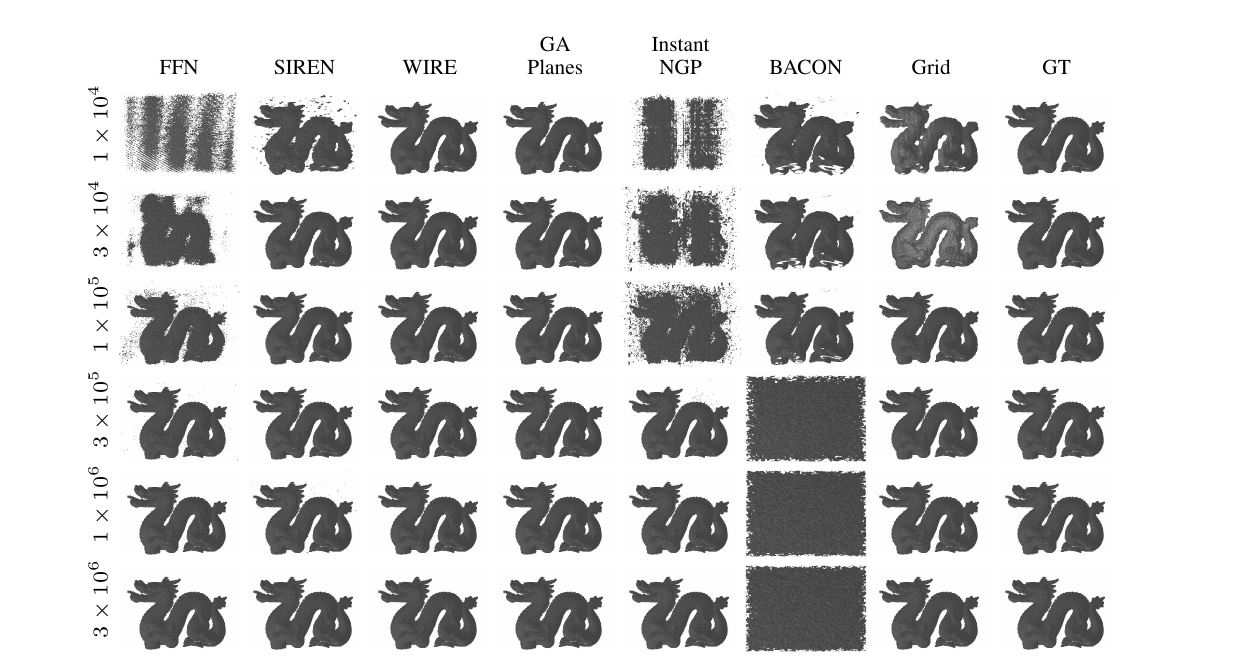
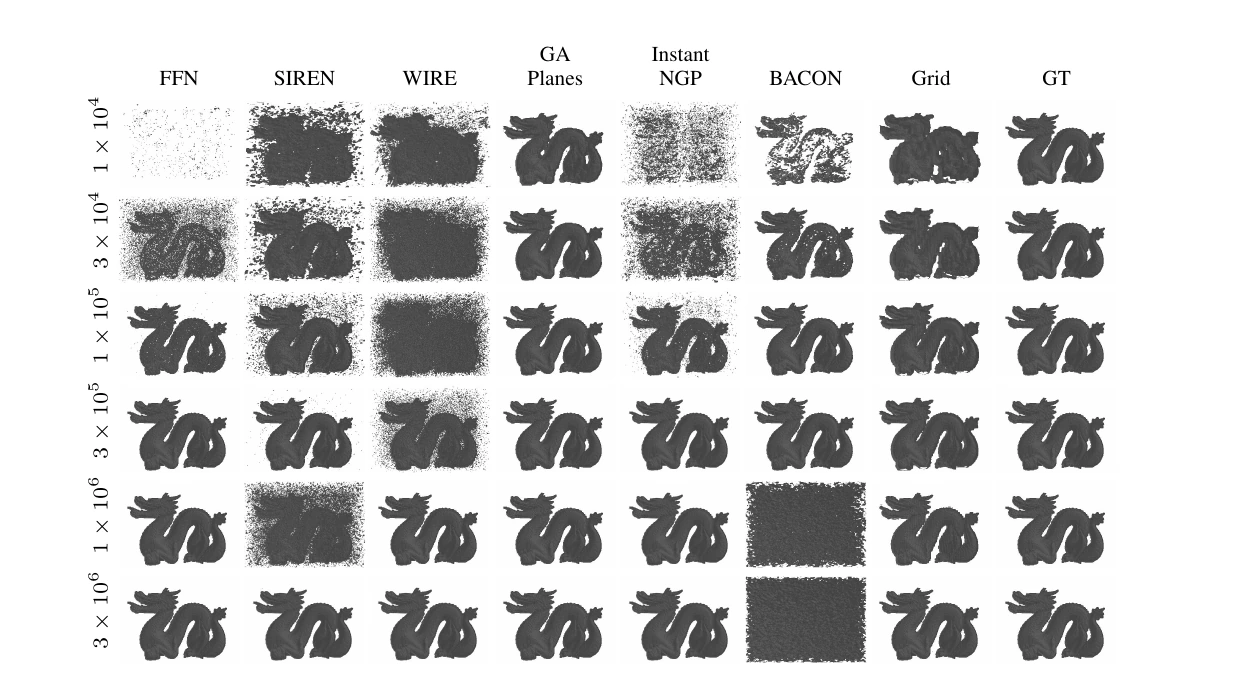
Rendered Stanford Dragon occupancy fitting results across methods and parameter budgets
Dragon Occupancy · renderingsRendered geometry makes fragmented or over-smoothed occupancy fields immediately apparent.
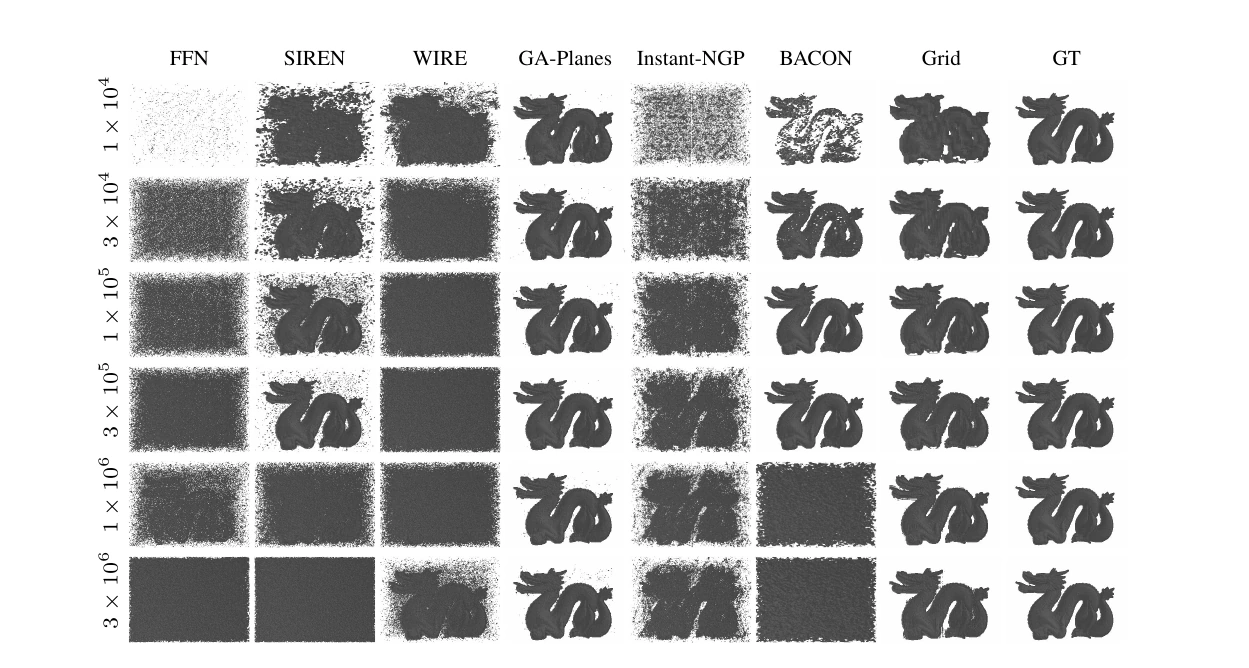
Rendered Stanford Dragon surface fitting results across methods and parameter budgets
Dragon Surface · renderingsSurface continuity varies sharply across representation family and budget.
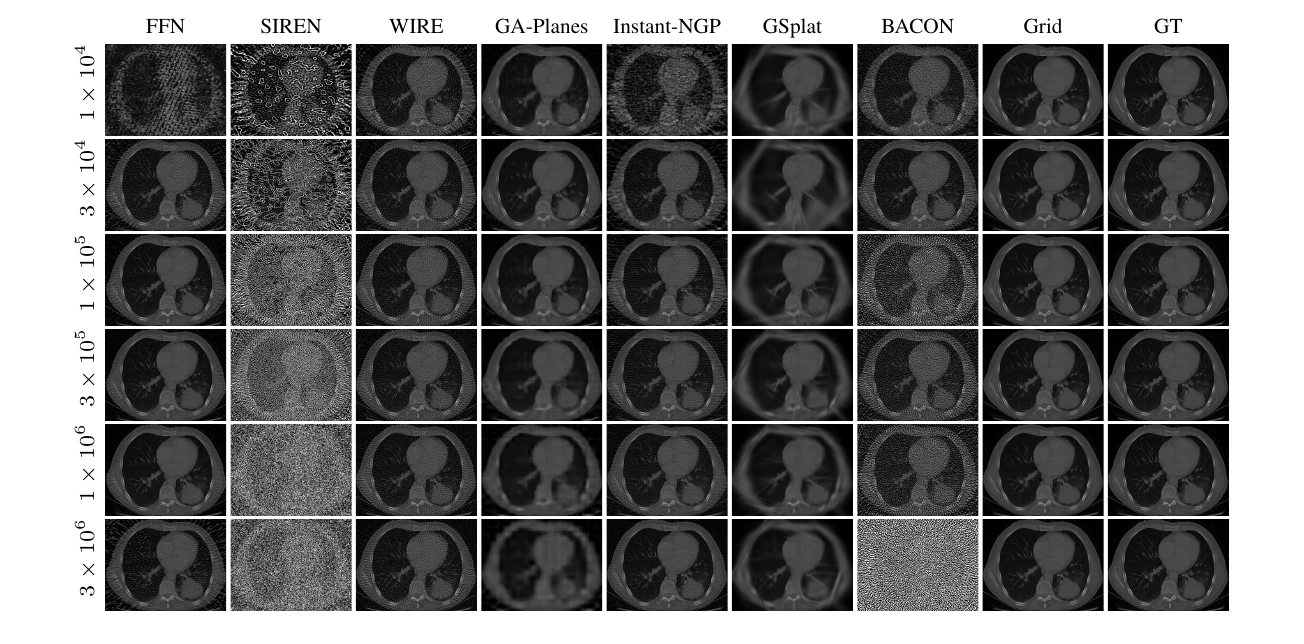
Sparse-view chest CT reconstruction across methods and parameter budgets
Sparse-view CT reconstructionThe TV-regularized Grid preserves anatomy and suppresses streak artifacts across the compressive regime.
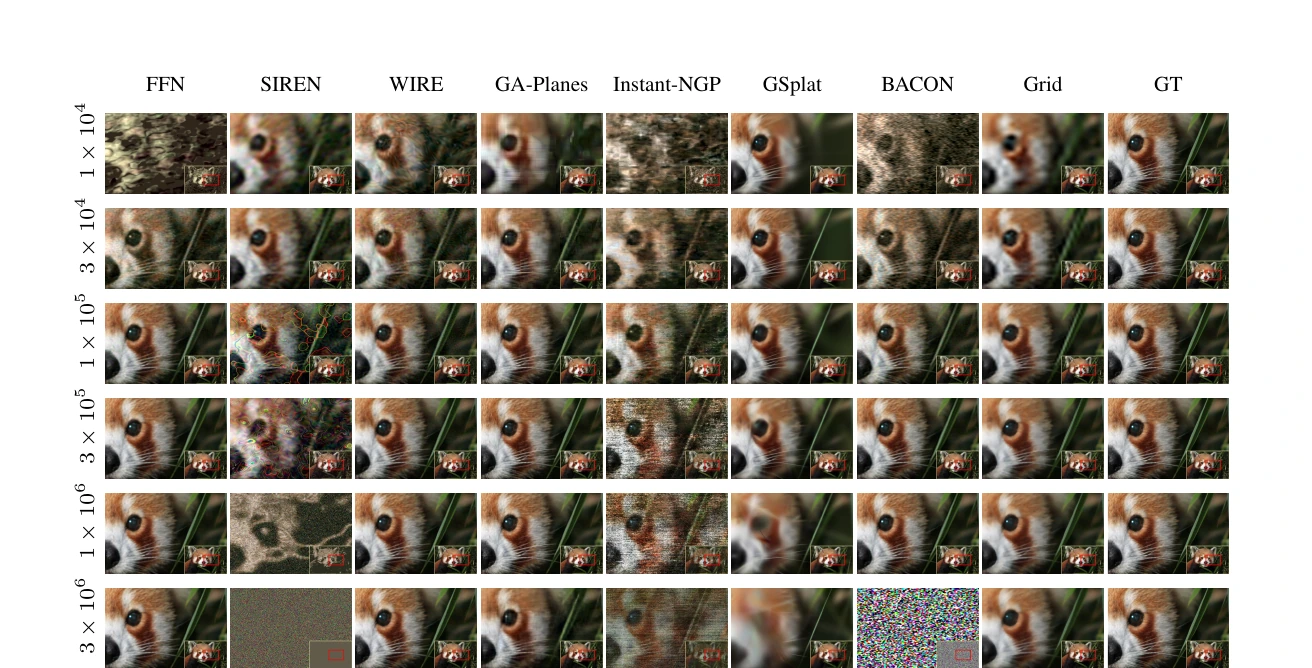
DIV2K image denoising with noise level epsilon 0.05 across methods and parameter budgets
DIV2K denoising · ε = 0.05Sharper reconstructions trade off against texture artifacts as capacity grows.
DIV2K image denoising with noise level epsilon 0.1 across methods and parameter budgets
DIV2K denoising · ε = 0.1Stronger noise makes overfitting and representation regularization easier to distinguish.
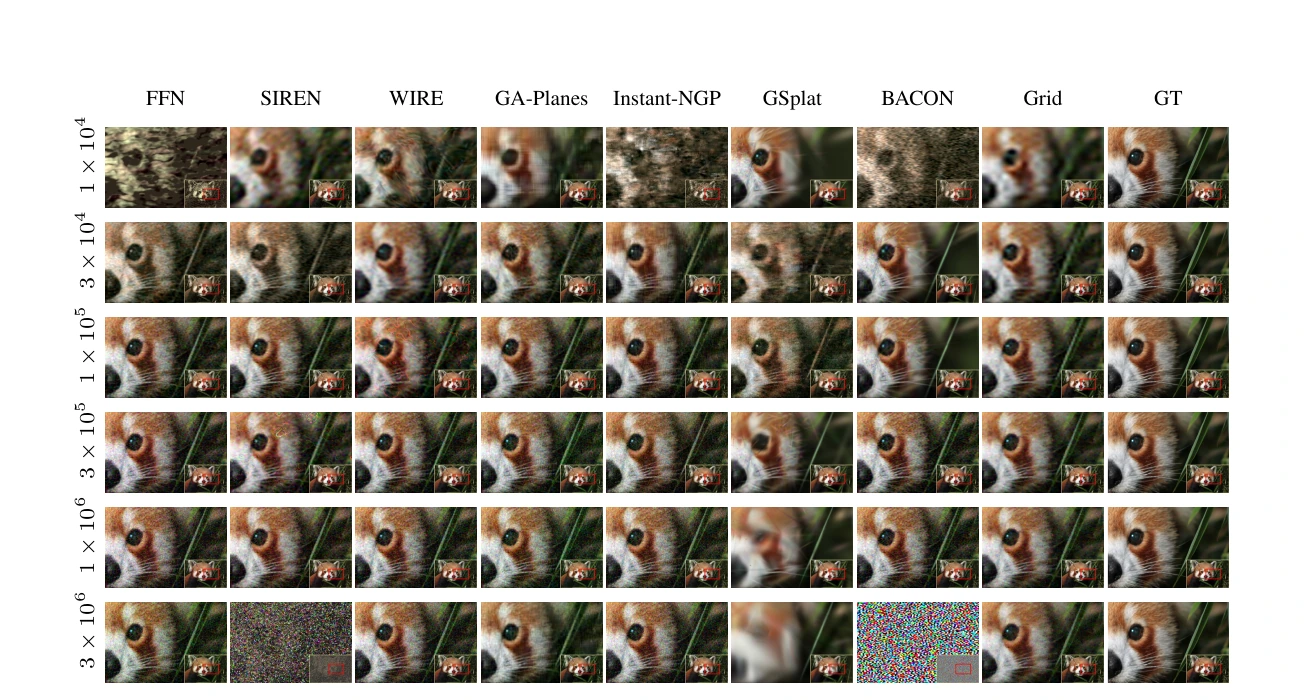
DIV2K four-times super-resolution across methods and parameter budgets
DIV2K · 4× super-resolutionFFN, WIRE, GA-Planes, and Grid converge to closely matched visual quality at medium and large budgets.
Stanford Dragon occupancy super-resolution slices across methods and parameter budgets
Dragon Occupancy · SR slicesGA-Planes retains high-IoU structure across the full model-size sweep.
Stanford Dragon surface super-resolution slices across methods and parameter budgets
Dragon Surface · SR slicesThin-surface recovery remains a favorable case for adaptive factorized models.
Rendered Stanford Dragon occupancy super-resolution results across methods and parameter budgets
Dragon Occupancy · SR renderingsRendering reveals missing regions that are less obvious in individual slices.
Rendered Stanford Dragon surface super-resolution results across methods and parameter budgets
Dragon Surface · SR renderingsThe final 3D view exposes continuity, sparsity, and geometric completeness.

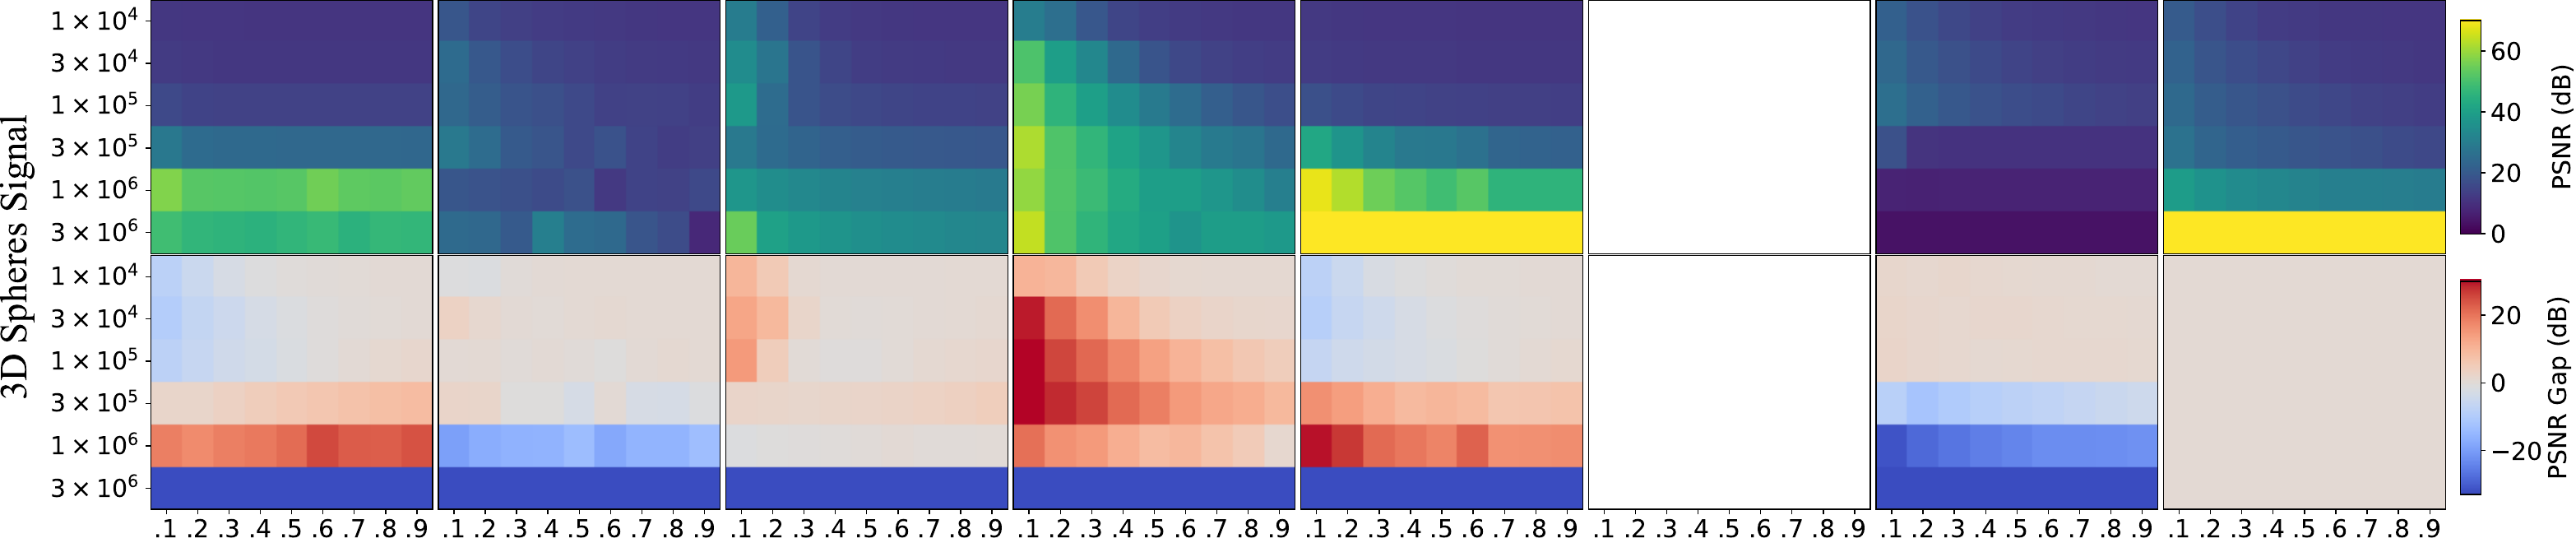
Bandwidth heatmaps

Every synthetic dataset, every budget, every bandwidth.

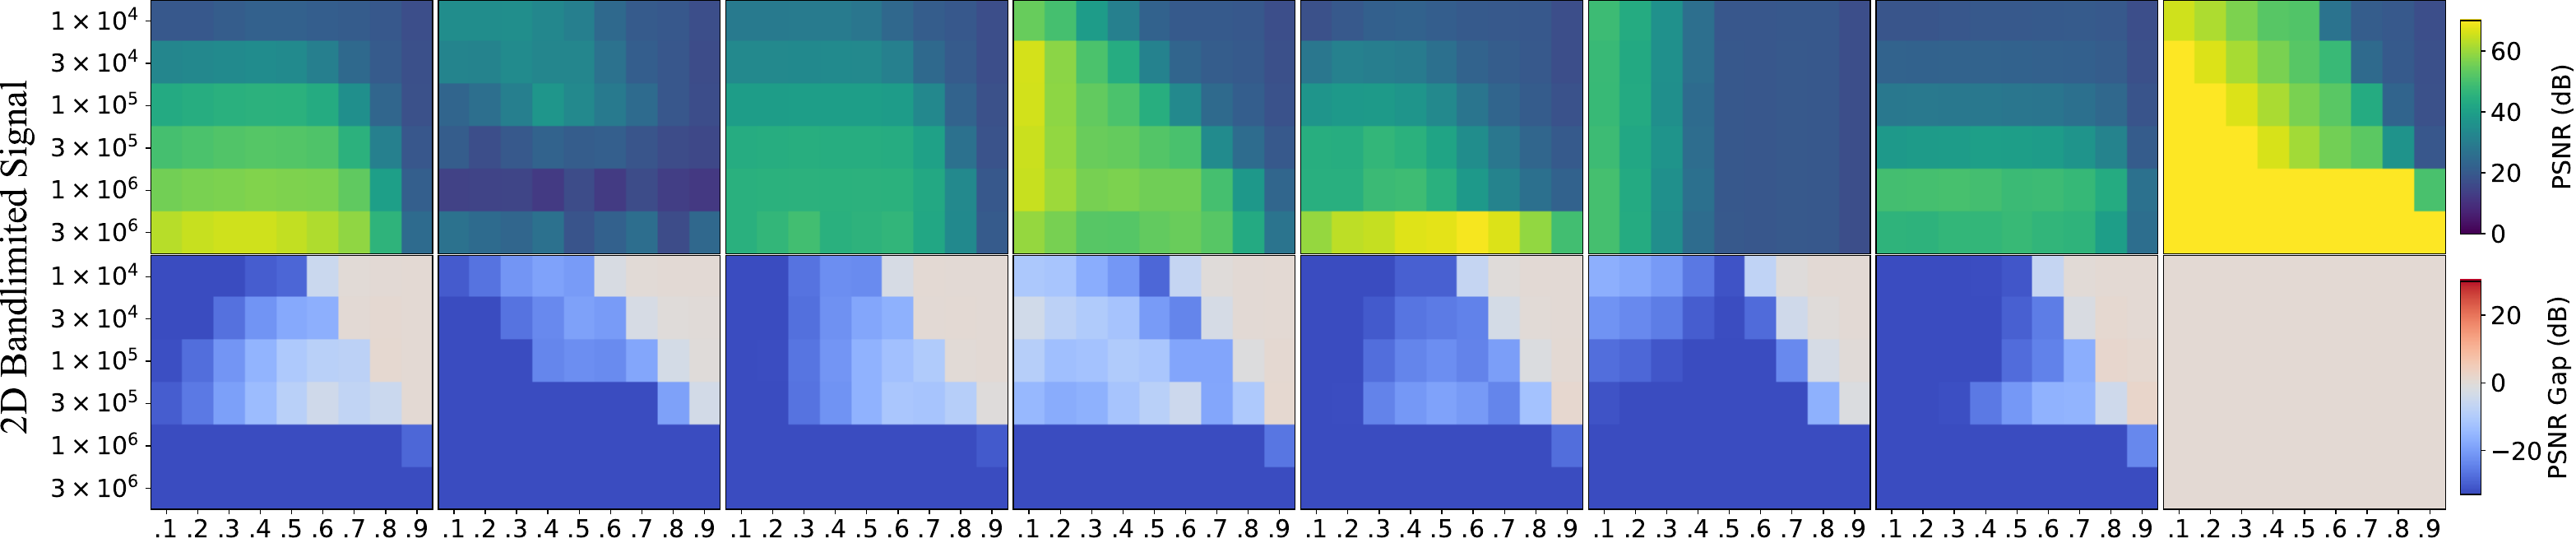
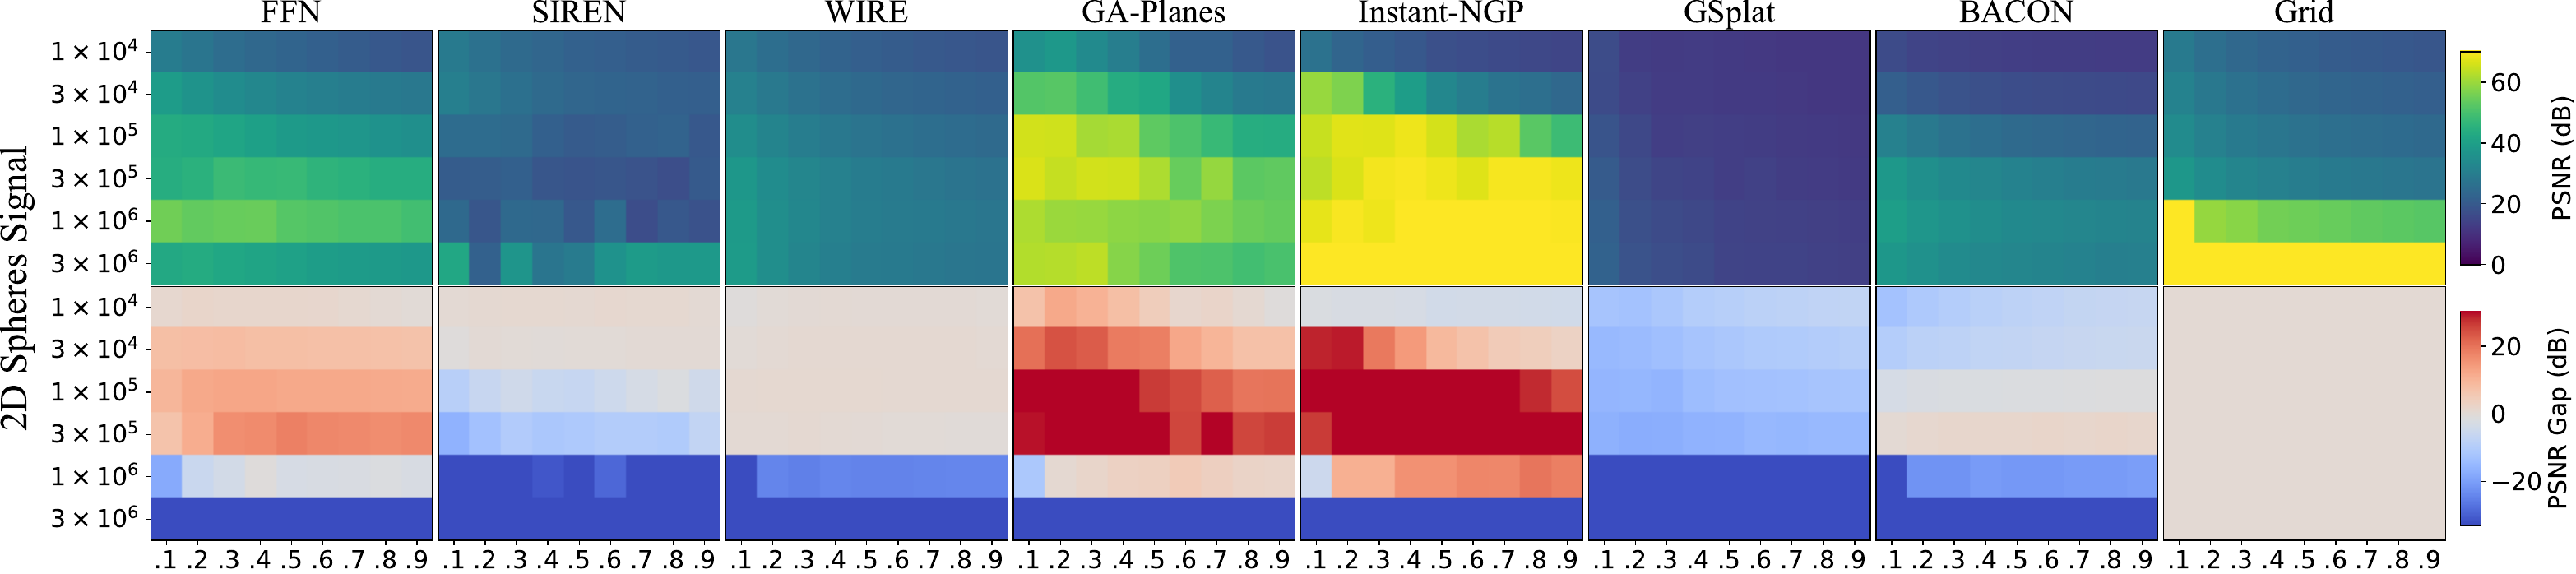
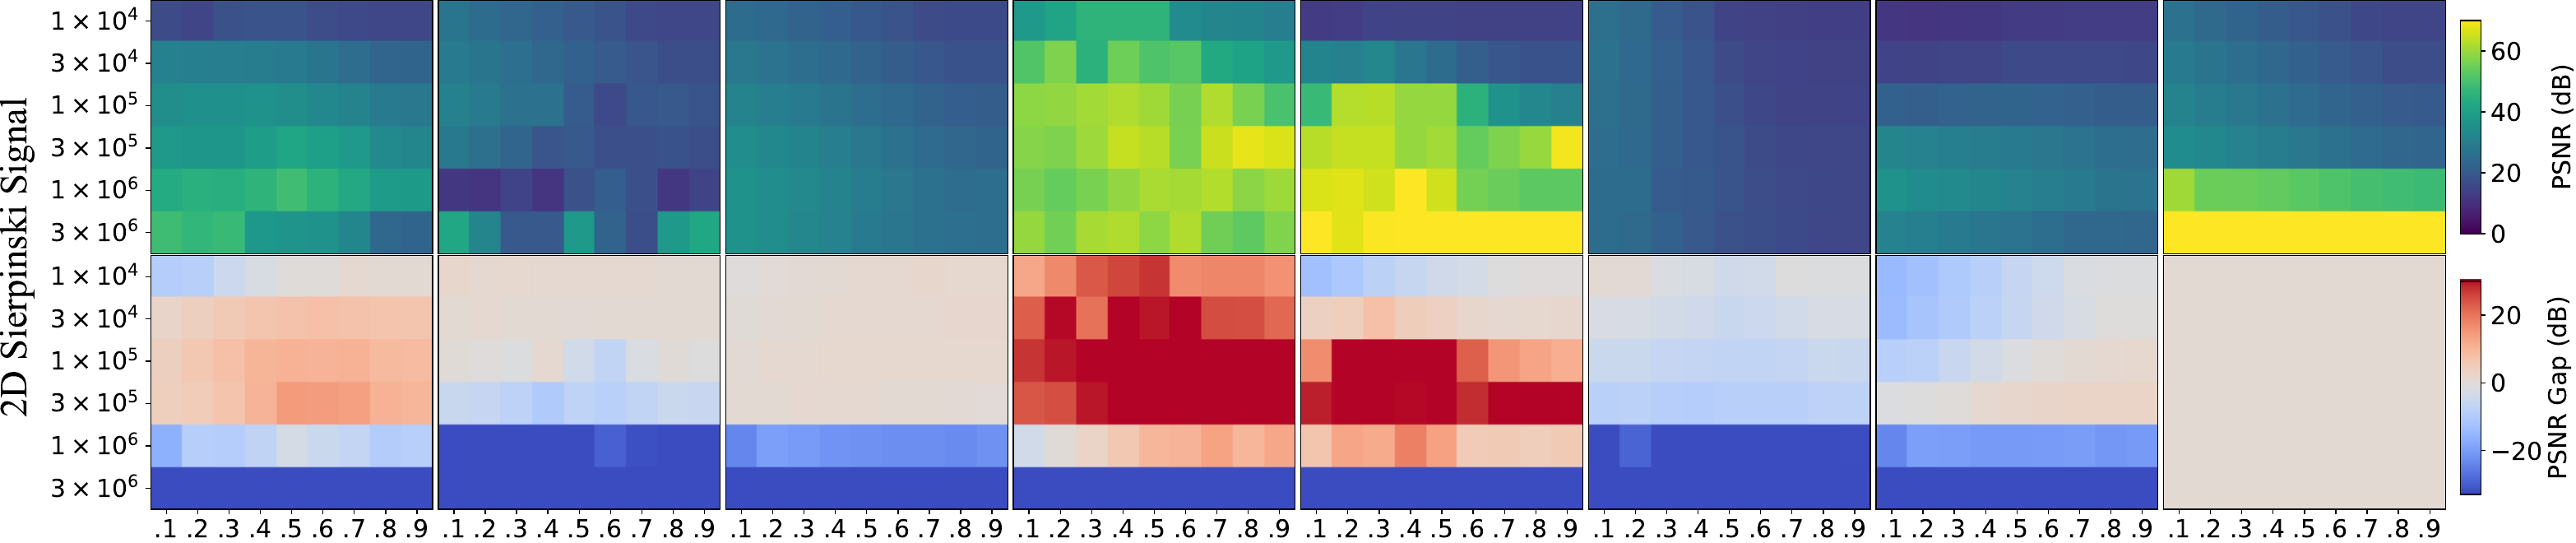
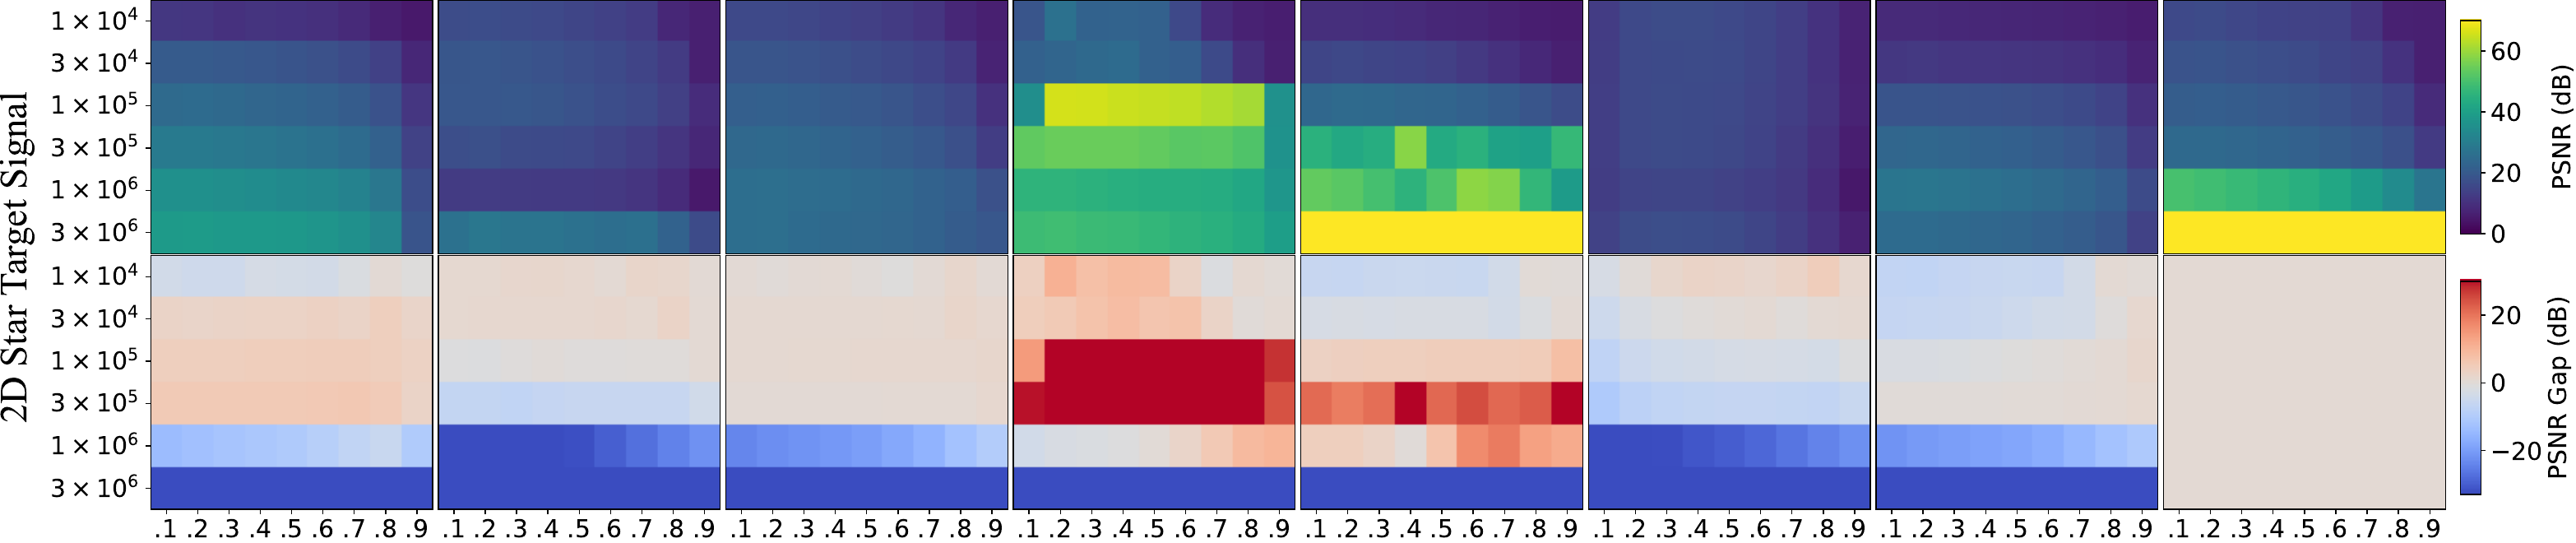
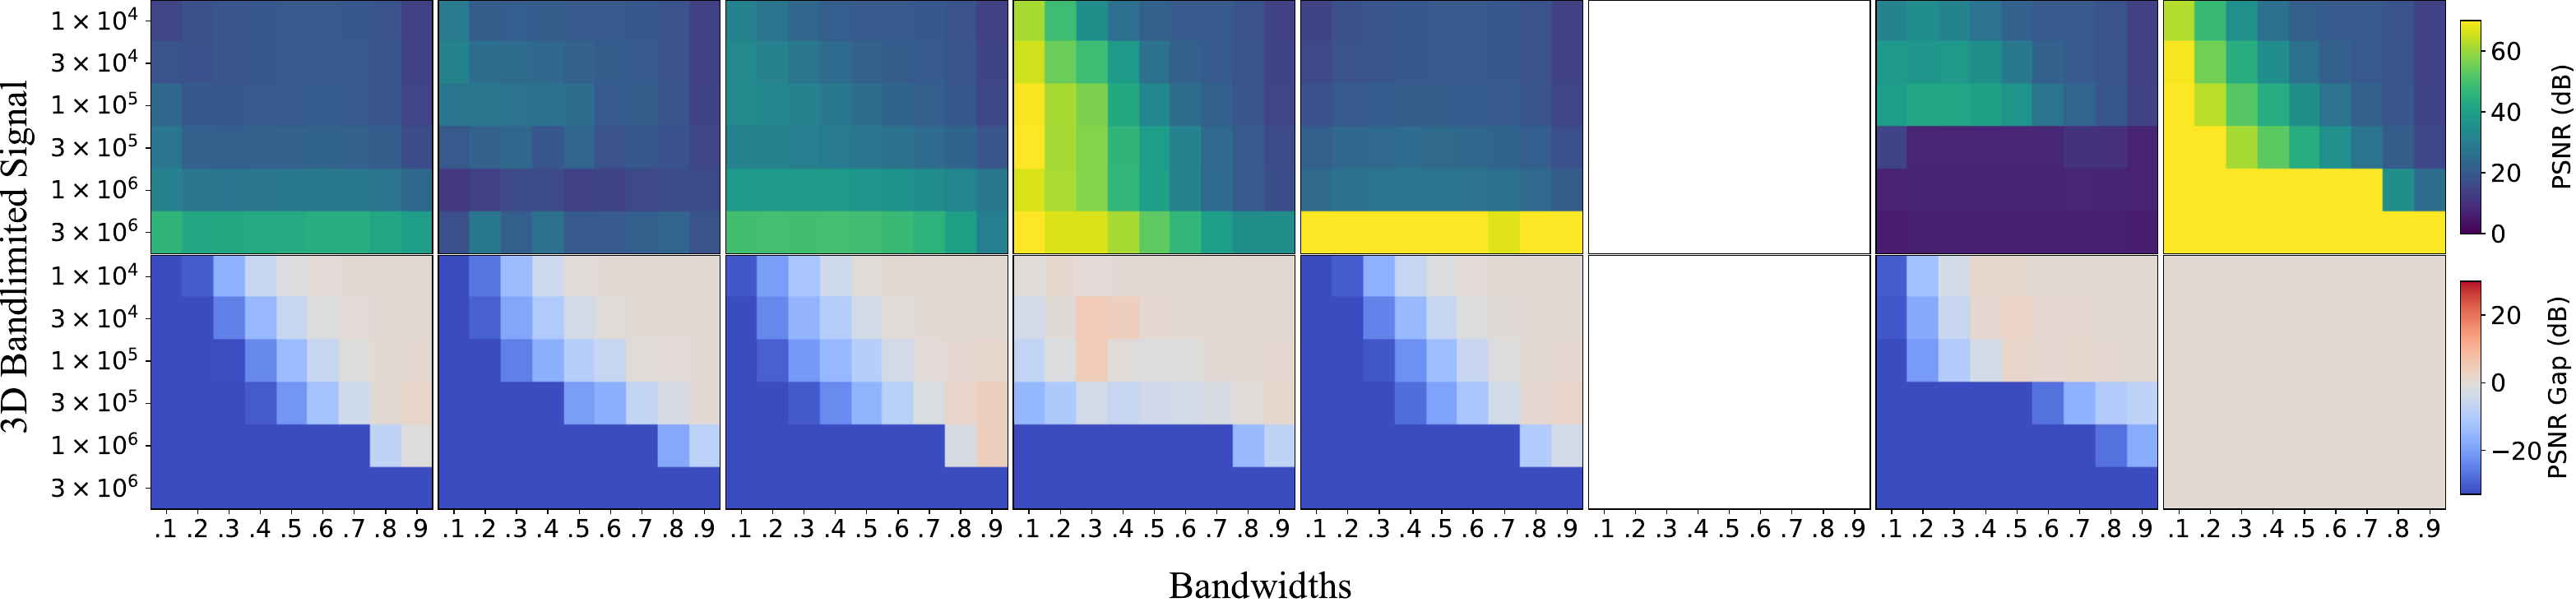
The top half of each plate reports absolute PSNR. The bottom half reports each method’s PSNR gap relative to Grid: red is better than Grid, blue is worse, and Grid itself is zero.

Method order: FFN · SIREN · WIRE · GA-Planes · Instant-NGP · GSplat · BACON · Grid · GSplat is not evaluated for 3D volumes.

2D sweeps

Dense frequencies, sparse geometry, fractals, and a radial target.

2D BandlimitedModel size increases downward; normalized bandwidth increases left to right.
PSNR and PSNR gap heatmaps for the 2D bandlimited signal across eight methods, six model sizes, and nine bandwidths
2D SpheresSparse binary contours produce a markedly different advantage map from dense signals.
PSNR and PSNR gap heatmaps for 2D sparse spheres across eight methods, six model sizes, and nine feature scales
2D SierpinskiGA-Planes and Instant-NGP show their strongest positive gaps at intermediate budgets.
PSNR and PSNR gap heatmaps for the 2D Sierpinski signal across eight methods, six model sizes, and nine levels
2D Star TargetThe continuous radial frequency sweep localizes where each method departs from Grid.
PSNR and PSNR gap heatmaps for the 2D Star Target across eight methods, six model sizes, and nine bandwidth regions

3D sweeps

Volumetric bandwidth and sparse boundaries.

3D BandlimitedGrid remains especially competitive as volumetric bandwidth and model size grow.
PSNR and PSNR gap heatmaps for the 3D bandlimited signal across seven applicable methods, six model sizes, and nine bandwidths
3D SpheresAdaptive models gain on sparse surfaces at selected model sizes and feature scales.
PSNR and PSNR gap heatmaps for 3D sparse spheres across seven applicable methods, six model sizes, and nine feature scales

Performance curves

Aggregate trends, separate from the qualitative plates.

These plots summarize fidelity across matched parameter budgets and isolate training speed and inverse-problem performance without mixing them into the visual appendix.

Compressed fitting and training speedDIV2K and Stanford Dragon PSNR across parameter budgets, plus relative optimization speed.
Performance curves for direct signal fitting and training speed across representation methods
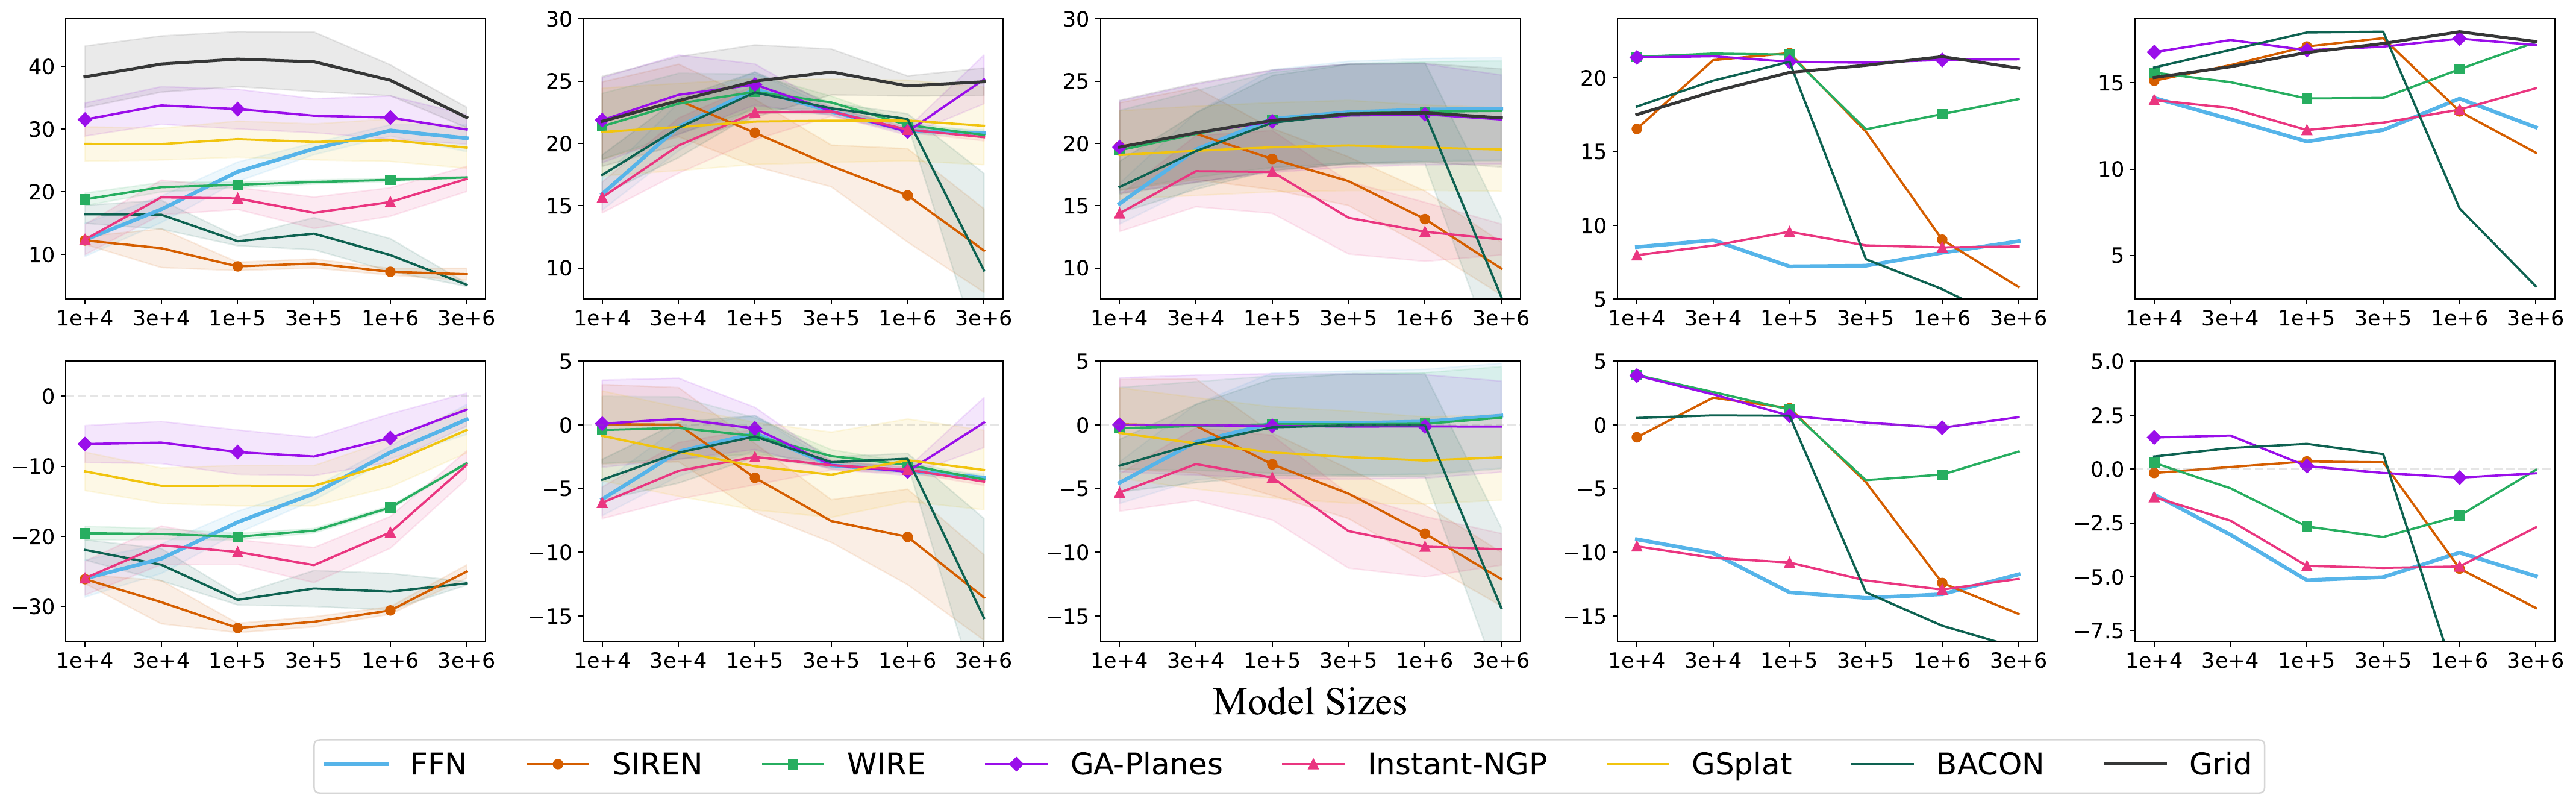
Inverse problemsCT reconstruction, image denoising, 4× super-resolution, and 3D super-resolution across matched budgets.
Performance curves for CT, denoising, image super-resolution, and 3D super-resolution across representation methods

Practical guidance

What wins where?

Choose a grid when

The signal is dense and fidelity-per-parameter matters.
Interpolation plus task-appropriate regularization is fast, stable, and difficult to beat for bandlimited signals and many natural-image inverse problems.
Consider an INR when

The signal has lower-dimensional or binary structure.
Neural and hybrid representations become more compelling on contours, occupancy boundaries, and selected highly compressed 3D tasks.

Always compare

At matched parameter budgets and across scales.

A single model size or signal type can conceal instability, compute cost, and frequency-dependent artifacts.

Citation

If this benchmark is useful, please cite it.

BibTeX
@inproceedings{kim2025grids,
  title     = {Grids Often Outperform Implicit Neural Representations
               at Compressing Dense Signals},
  author    = {Kim, Namhoon and Fridovich-Keil, Sara},
  booktitle = {Advances in Neural Information Processing Systems},
  year      = {2025},
  url       = {https://arxiv.org/abs/2506.11139}
}